A function to compute false colors representing a numeric or categorical variable
level.colors.RdCalculates false colors from a numeric variable (including factors, using their numeric codes) given a color scheme and breakpoints.
level.colors(x, at, col.regions, colors = TRUE, ...)Arguments
- x
A numeric or
factorvariable.- at
A numeric variable of breakpoints defining intervals along the range of
x.- col.regions
A specification of the colors to be assigned to each interval defined by
at. This could be either a vector of colors, or a function that produces a vector of colors when called with a single argument giving the number of colors. See details below.- colors
logical indicating whether colors should be computed and returned. If
FALSE, only the indices representing which interval (among those defined byat) each value inxfalls into is returned.- ...
Extra arguments, ignored.
Value
A vector of the same length as x. Depending on the
colors argument, this could be either a vector of colors (in
a form usable by R), or a vector of integer indices representing
which interval the values of x fall in.
See also
Details
If at has length n, then it defines n-1 intervals. Values of
x outside the range of at are not assigned to an
interval, and the return value is NA for such values.
Colors are chosen by assigning a color to each of the n-1 intervals.
If col.regions is a palette function (such as
topo.colors, or the result of calling
colorRampPalette), it is called with n-1 as an argument
to obtain the colors. Otherwise, if there are exactly n-1 colors in
col.regions, these get assigned to the intervals. If there are
fewer than n-1 colors, col.regions gets recycled. If there are
more, a more or less equally spaced (along the length of
col.regions) subset is chosen.
Examples
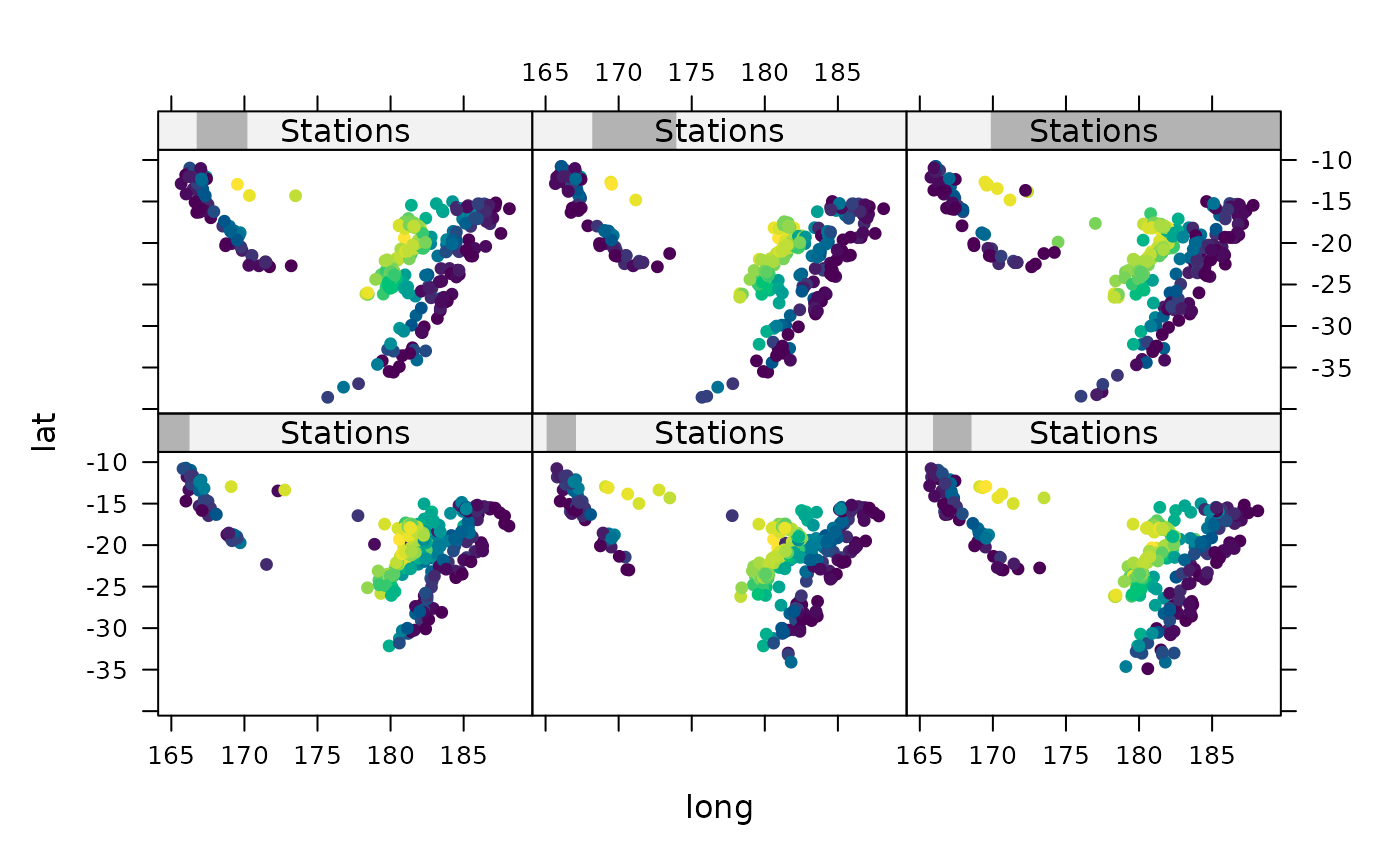
depth.col <-
    with(quakes,
         level.colors(depth, at = do.breaks(range(depth), 30),
                      col.regions = hcl.colors))


xyplot(lat ~ long | equal.count(stations), quakes,
       strip = strip.custom(var.name = "Stations"),
       colours = depth.col,
       panel = function(x, y, colours, subscripts, ...) {
           panel.xyplot(x, y, pch = 21, col = "transparent",
                        fill = colours[subscripts], ...)
       })