shingles
shingles.RdFunctions to handle shingles
shingle(x, intervals=sort(unique(x)))
equal.count(x, ...)
as.shingle(x)
is.shingle(x)

# S3 method for class 'shingle'
plot(x, panel, xlab, ylab, ...)

# S3 method for class 'shingle'
print(x, showValues = TRUE, ...)

# S3 method for class 'shingleLevel'
as.character(x, ...)

# S3 method for class 'shingleLevel'
print(x, ...)

# S3 method for class 'shingle'
summary(object, showValues = FALSE, ...)

<!-- % \method{as.data.frame}{shingle}(x, row.names = NULL, optional = FALSE) -->

# S3 method for class 'shingle'
x[subset, drop = FALSE]
as.factorOrShingle(x, subset, drop)
Arguments
- x
numeric variable or R object, shingle in
plot.shingleandx[]. An object (list of intervals) of class "shingleLevel" inprint.shingleLevel- object
shingle object to be summarized
- showValues
logical, whether to print the numeric part. If FALSE, only the intervals are printed
- intervals
numeric vector or matrix with 2 columns
- subset
logical vector
- drop
whether redundant shingle levels are to be dropped
- panel, xlab, ylab
standard Trellis arguments (see
xyplot)- ...
other arguments, passed down as appropriate. For example, extra arguments to
equal.countare passed on toco.intervals. graphical parameters can be passed as arguments to theplotmethod.
Details
A shingle is a data structure used in Trellis, and is a generalization
of factors to ‘continuous’ variables. It consists of a numeric
vector along with some possibly overlapping intervals. These intervals
are the ‘levels’ of the shingle. The levels and
nlevels functions, usually applicable to factors, also work on
shingles. The implementation of shingles is slightly different from
S.
There are print methods for shingles, as well as for printing the
result of levels() applied to a shingle. For use in labelling,
the as.character method can be used to convert levels of a
shingle to character strings.
equal.count converts x to a shingle using the equal
count algorithm. This is essentially a wrapper around
co.intervals. All arguments are passed to co.intervals.
shingle creates a shingle using the given intervals. If
intervals is a vector, these are used to form 0 length
intervals.
as.shingle returns shingle(x) if x is not a
shingle.
is.shingle tests whether x is a shingle.
plot.shingle displays the ranges of shingles via
rectangles. print.shingle and summary.shingle describe
the shingle object.
Value
x$intervals for levels.shingle(x),
logical for is.shingle, an object of class "trellis" for
plot (printed by default by print.trellis), and
an object of class "shingle" for the others.
See also
Examples
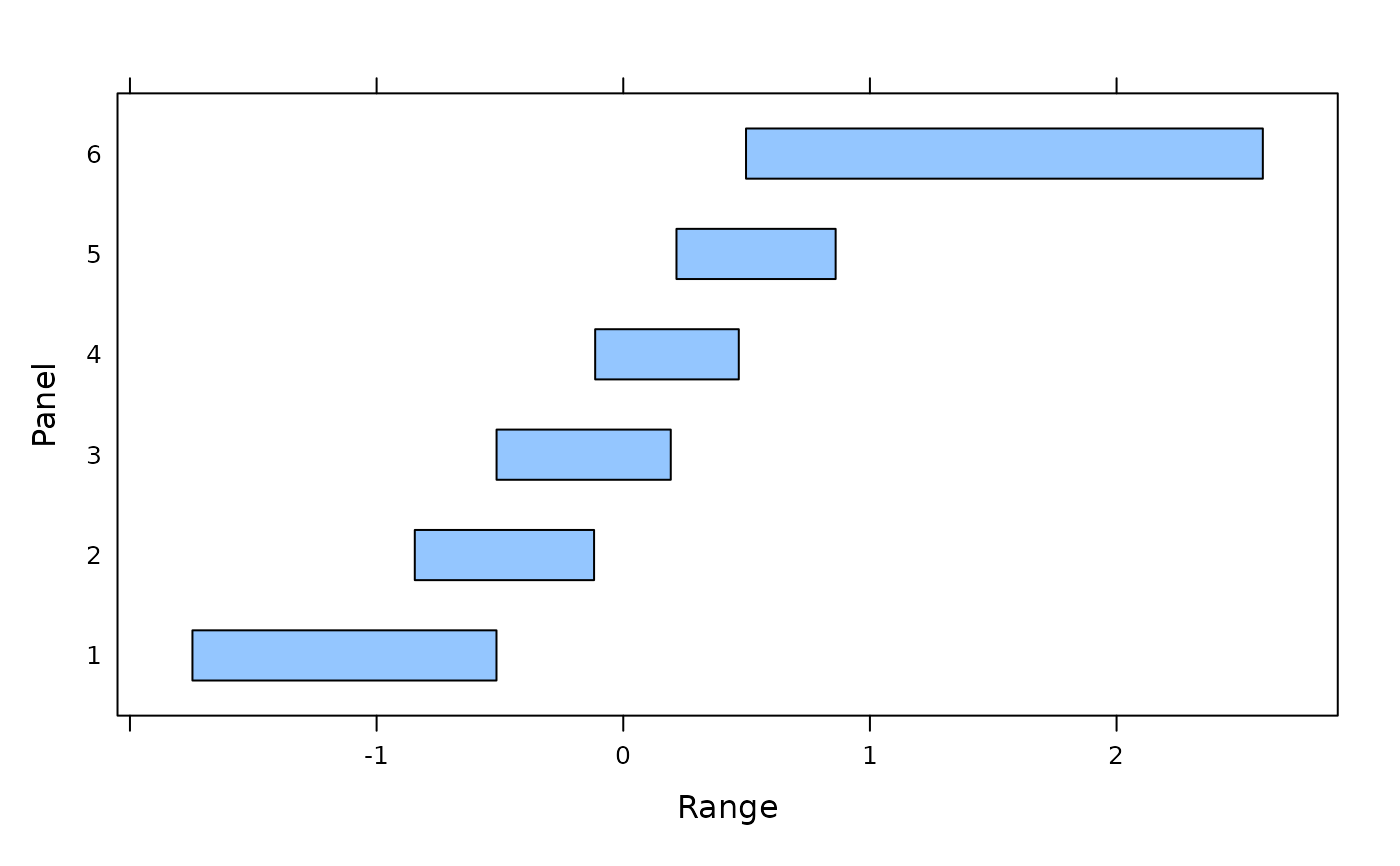
z <- equal.count(rnorm(50))
plot(z)

print(z)
#>
#> Data:
#>  [1]  0.216046502  1.571611797 -1.643915354  0.958991245  0.685229155
#>  [6] -0.397342347  0.658412511 -0.844875931  0.299029129 -0.936650812
#> [11]  1.848837344  1.066723621 -0.113544225 -0.545702686  0.389848621
#> [16]  0.191565785 -0.426077105  0.192232214  0.240245246  0.829474267
#> [21]  0.065210699 -0.718171180  0.329488208  0.653189148 -0.001696261
#> [26]  1.018773106 -0.516855854  0.860700144 -1.577478547 -0.118675036
#> [31]  1.874550023  0.321527645 -0.713218449 -1.016659218  0.498047978
#> [36] -0.549033220  0.138576958 -0.514350376 -0.513330315  0.060939089
#> [41] -1.381593981 -1.746315536 -0.205437996 -1.267380383  0.468031572
#> [46] -0.414336613 -0.012369357 -0.381949599  0.600952412  2.592652733
#>
#> Intervals:
#>          min        max count
#> 1 -1.7466488 -0.5140172    14
#> 2 -0.8452091 -0.1183418    14
#> 3 -0.5136635  0.1925654    15
#> 4 -0.1138774  0.4683648    15
#> 5  0.2157133  0.8610334    14
#> 6  0.4977148  2.5929859    14
#>
#> Overlap between adjacent intervals:
#> [1] 7 7 8 7 7
print(levels(z))
#>            [,1]       [,2]
#> [1,] -1.7466488 -0.5140172
#> [2,] -0.8452091 -0.1183418
#> [3,] -0.5136635  0.1925654
#> [4,] -0.1138774  0.4683648
#> [5,]  0.2157133  0.8610334
#> [6,]  0.4977148  2.5929859
print(z)
#>
#> Data:
#> [1] 0.216046502 1.571611797 -1.643915354 0.958991245 0.685229155
#> [6] -0.397342347 0.658412511 -0.844875931 0.299029129 -0.936650812
#> [11] 1.848837344 1.066723621 -0.113544225 -0.545702686 0.389848621
#> [16] 0.191565785 -0.426077105 0.192232214 0.240245246 0.829474267
#> [21] 0.065210699 -0.718171180 0.329488208 0.653189148 -0.001696261
#> [26] 1.018773106 -0.516855854 0.860700144 -1.577478547 -0.118675036
#> [31] 1.874550023 0.321527645 -0.713218449 -1.016659218 0.498047978
#> [36] -0.549033220 0.138576958 -0.514350376 -0.513330315 0.060939089
#> [41] -1.381593981 -1.746315536 -0.205437996 -1.267380383 0.468031572
#> [46] -0.414336613 -0.012369357 -0.381949599 0.600952412 2.592652733
#>
#> Intervals:
#> min max count
#> 1 -1.7466488 -0.5140172 14
#> 2 -0.8452091 -0.1183418 14
#> 3 -0.5136635 0.1925654 15
#> 4 -0.1138774 0.4683648 15
#> 5 0.2157133 0.8610334 14
#> 6 0.4977148 2.5929859 14
#>
#> Overlap between adjacent intervals:
#> [1] 7 7 8 7 7
print(levels(z))
#> [,1] [,2]
#> [1,] -1.7466488 -0.5140172
#> [2,] -0.8452091 -0.1183418
#> [3,] -0.5136635 0.1925654
#> [4,] -0.1138774 0.4683648
#> [5,] 0.2157133 0.8610334
#> [6,] 0.4977148 2.5929859