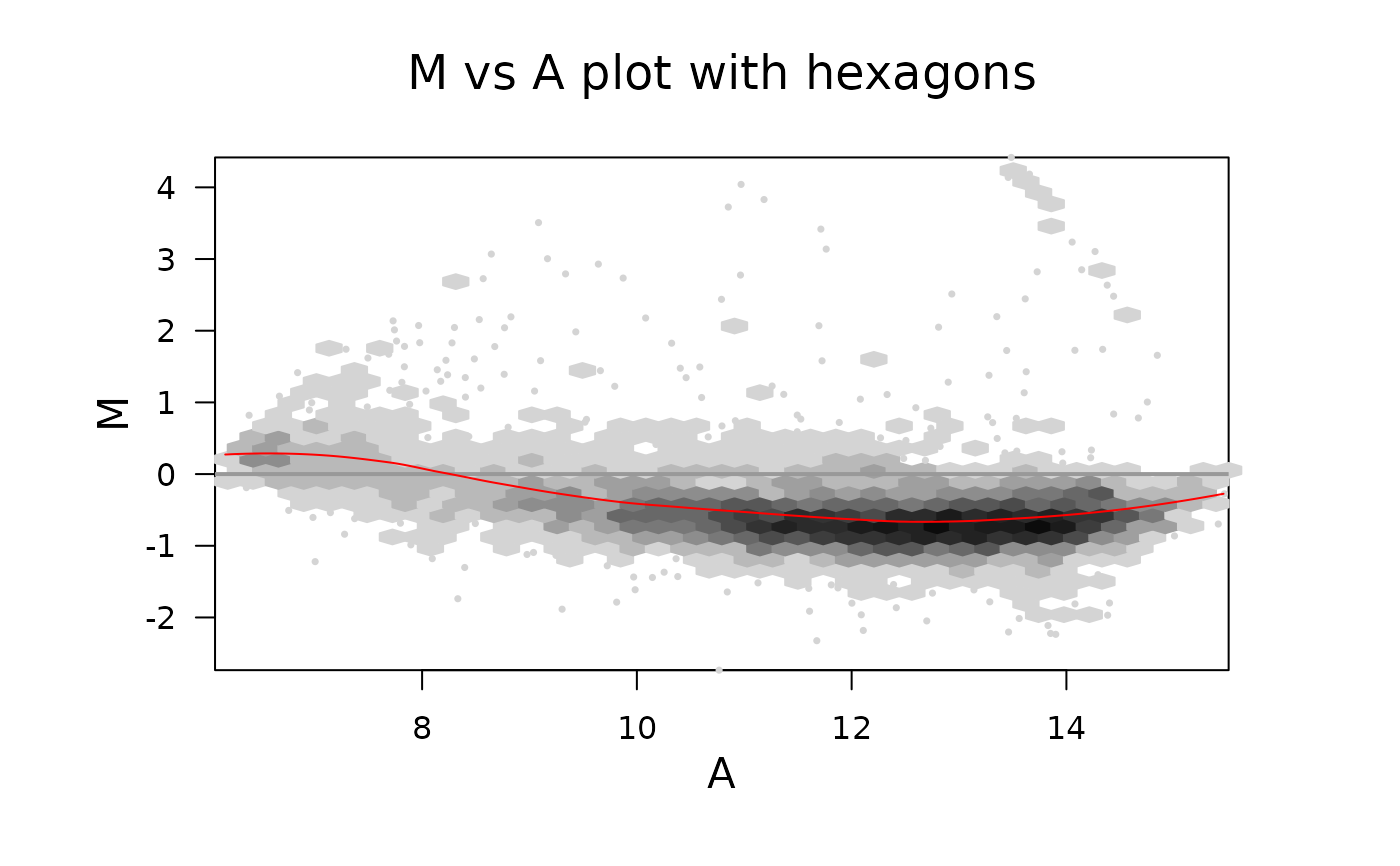
MA-plot using hexagon bins
plotMAhex.RdCreates an MA-plot using hexagons with color/glyph coding for control spots.
Usage
plotMAhex(MA, array = 1, xlab = "A", ylab = "M",
          main = colnames(MA)[array], xlim = NULL, ylim = NULL,
          status = NULL, values, pch, col, cex, nbin = 40,
          zero.weights = FALSE, style = "colorscale", legend = 1.2,
          lcex = 1, minarea = 0.04, maxarea = 0.8, mincnt = 2,
          maxcnt = NULL, trans = NULL, inv = NULL, colorcut = NULL,
          border = NULL, density = NULL, pen = NULL,
          colramp = function(n) { LinGray(n, beg = 90, end = 15) },
          newpage = TRUE, type = c("p", "l", "n"),
          xaxt = c("s", "n"), yaxt = c("s", "n"),
          verbose = getOption("verbose"))
Arguments
- MA
an
RGList,MAListorMArrayLMobject, or any list with componentsMcontaining log-ratios andAcontaining average intensities. Alternatively amatrix,AffybatchorExpressionSetobject.- array
integer giving the array to be plotted. Corresponds to columns of
MandA.- xlab, ylab, main
character strings giving label for x-axis, y-axis or main tile of the plot.
- xlim, ylim
numeric vectors of length 2 giving limits for x-axis (or y-axis respectively), defaulting to min and max of the data.
- status
character vector giving the control status of each spot on the array, of same length as the number of rows of
MA$M. If omitted, all points are plotted in the default color, symbol and size.- values
character vector giving values of
statusto be highlighted on the plot. Defaults to unique values ofstatus. Ignored if there is nostatusvector.- pch
vector or list of plotting characters. Default to integer code 16. Ignored is there is no
statusvector.- col
numeric or character vector of colors, of the same length as
values. Defaults to1:length(values). Ignored if there is nostatusvector.- cex
numeric vector of plot symbol expansions, of the the same length as
values. Defaults to 0.2 for the most common status value and 1 for the others. Ignored if there is nostatusvector.- nbin
Number of bins
- zero.weights
logical, should spots with zero or negative weights be plotted?
- style
string specifying the style of hexagon plot, see
grid.hexagonsfor the possibilities.- legend
numeric width of the legend in inches of
FALSE. In the latter case, or when0, no legend is not produced.- lcex
characters expansion size for the text in the legend.
- minarea
fraction of cell area for the lowest count.
- maxarea
fraction of the cell area for the largest count.
- mincnt
cells with fewer counts are ignored.
- maxcnt
cells with more counts are ignored.
- trans
functionspecifying a transformation for the counts such assqrt.- inv
the inverse transformation of
trans.- colorcut
vector of values covering [0, 1] that determine hexagon color class boundaries and hexagon legend size boundaries. Alternatively, an integer (
<= maxcnt) specifying the number of equispaced colorcut values in [0,1].- border, density, pen
color for polygon borders and filling of each hexagon drawn, passed to
grid.hexagons.- colramp
function accepting an integer
nas an argument and returning n colors.- newpage
should a new page start?
- type, xaxt, yaxt
strings to be used (when set to
"n") for suppressing the plotting of hexagon symbols, or the x- or y-axis, respectively.- verbose
logical indicating if some diagnostic output should happen.
Details
An MA-plot is a plot of log-intensity ratios (M-values) versus
log-intensity averages (A-values). If MA is an RGList or
MAList then this function produces an ordinary within-array
MA-plot. If MA is an MArrayLM object, then the plot is an
fitted model MA-plot in which the estimated coefficient is on the y-axis
and the average A-value is on the x-axis.
If MA is a matrix or ExpressionSet object, then this
function produces a between-array MA-plot. In this case the A-values in
the plot are the average log-intensities across the arrays and the
M-values are the deviations of the log-intensities for the specified
array from the average. If there are more than five arrays, then the
average is computed robustly using medians. With five or fewer arrays,
it is computed by means.
The status vector is intended to specify the control status of
each spot, for example "gene", "ratio control", "house keeping gene",
"buffer" and so on. The vector is usually computed using the function
controlStatus from package limma and a
spot-types file. However the function may be used to highlight any
subset of spots.
The arguments values, pch, col and cex
can be included as attributes to status instead of being
passed as arguments to plotMA.
See points for possible values for pch,
col and cex.
Value
A plot is created on the current graphics device. and a list with the following items is returned invisibly:
- plot.vp
the
hexViewportconstructed and used.- legend.vp
if a legend has been produced, its
viewport.- hbin
a
hexbinobject built with A as the x coordinate and M as the y coordinate.
See also
plotMA from package limma,
and gplot.hexbin.
Examples
  if(require(marray)){
    data(swirl)
    hb <- plotMAhex(swirl[,1],newpage=FALSE,
                    main = "M vs A plot with hexagons", legend=0)
    hexVP.abline(hb$plot.vp,h=0,col=gray(.6))
    hexMA.loess(hb)
  }