Add Loess Fit to Hexplot
hexMA.loess.RdFit a loess line using the hexagon centers of mass as the x and y coordinates and the cell counts as weights.
Usage
hexMA.loess(pMA, span = 0.4, col = "red", n = 200, ...)
hexVP.loess(hbin, hvp = NULL, span = 0.4, col = "red", n = 200, ...)
Arguments
- hbin
an object of class
hexbin, seehexbin.- hvp
A
hexViewportobject.- pMA
the list returned by
plotMAhex.- span
the parameter alpha which controls the degree of smoothing.
- col
line color for the loess fit.
- n
number of points at which the fit should be evaluated.
- ...
Additional graphical parameter settings for the
loessline fit; seegpar.
Examples
if(require(marray)){
data(swirl)
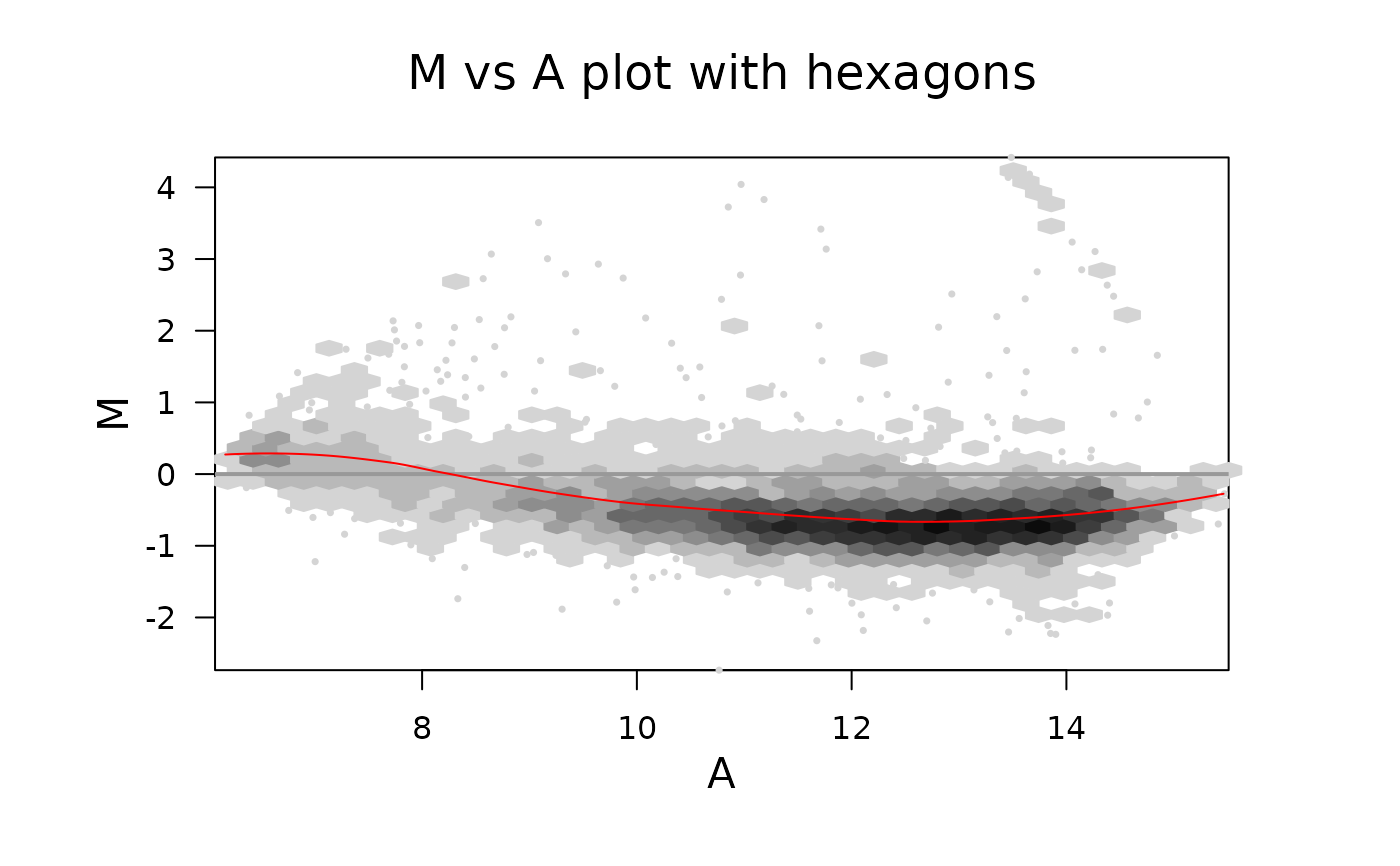
hb <- plotMAhex(swirl[,1], main = "M vs A plot with hexagons", legend=0)
hexVP.abline(hb$plot, h=0, col= gray(.6))
hexMA.loess(hb)
}
#> Loading required package: marray
#> Loading required package: limma
 dat <- data.frame(x=rnorm(1000), y=rnorm(1000))
bin <- hexbin(dat$x, dat$y)
hb <- plot(bin)
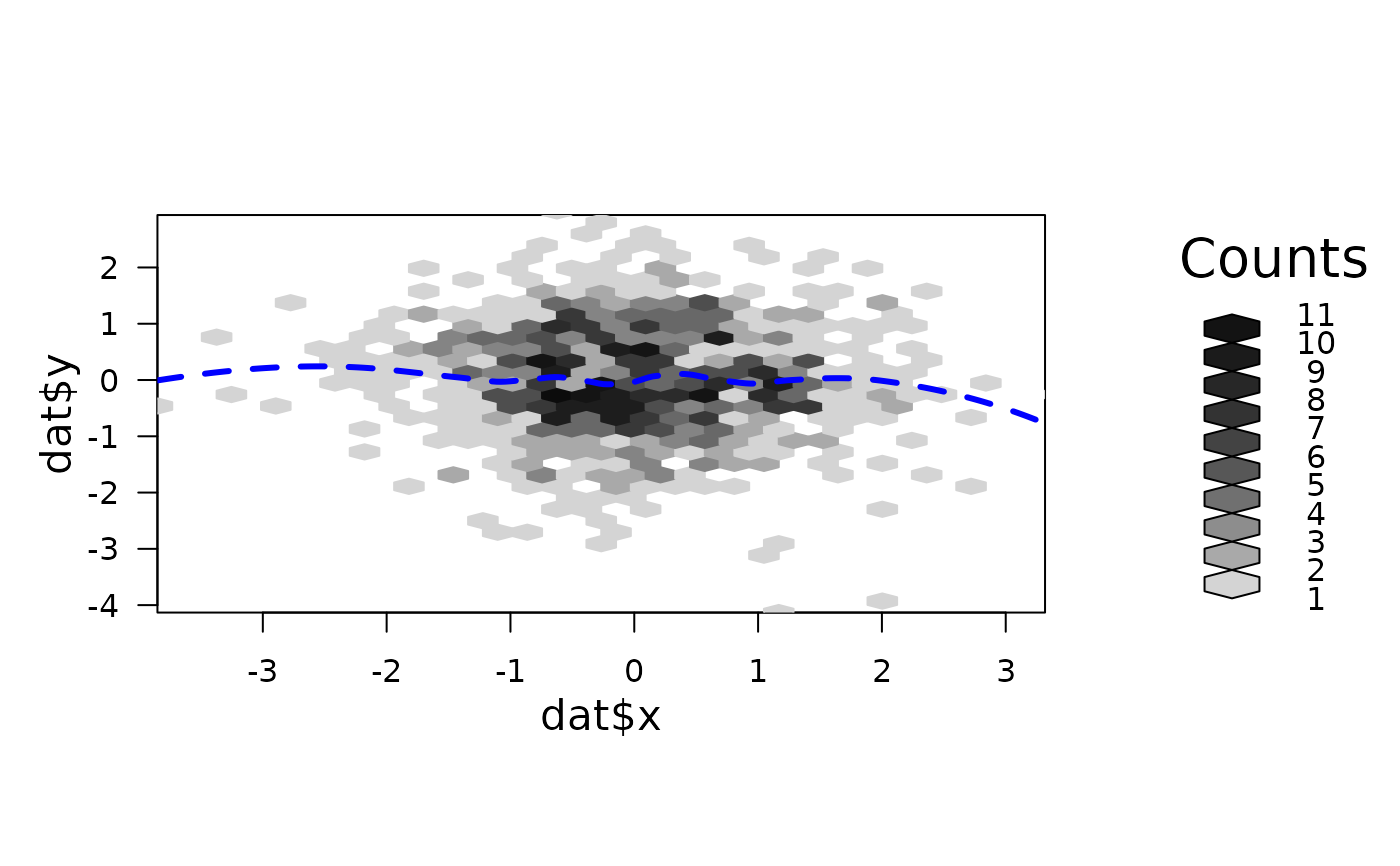
hexVP.loess(bin, hvp = hb$plot.vp, span = 0.4, n = 200, col = "blue", lwd = 3, lty = "dashed")
dat <- data.frame(x=rnorm(1000), y=rnorm(1000))
bin <- hexbin(dat$x, dat$y)
hb <- plot(bin)
hexVP.loess(bin, hvp = hb$plot.vp, span = 0.4, n = 200, col = "blue", lwd = 3, lty = "dashed")