grid.pattern_fill() draws a simple fill pattern onto the graphics device.
Arguments
- x
A numeric vector or unit object specifying x-locations of the pattern boundary.
- y
A numeric vector or unit object specifying y-locations of the pattern boundary.
- id
A numeric vector used to separate locations in x, y into multiple boundaries. All locations within the same
idbelong to the same boundary.- ...
Currently ignored
- fill
Fill colour(s) or
grid::pattern()/ gradient object(s).- alpha
Alpha (between 0 and 1) or
NA(default, preserves colors' alpha value).- default.units
A string indicating the default units to use if
xoryare only given as numeric vectors.- name
A character identifier.
- gp
An object of class
"gpar", typically the output from a call to the functiongpar. This is basically a list of graphical parameter settings.- draw
A logical value indicating whether graphics output should be produced.
- vp
A Grid viewport object (or NULL).
Value
A grid grob object invisibly. If draw is TRUE then also draws to the graphic device as a side effect.
See also
Examples
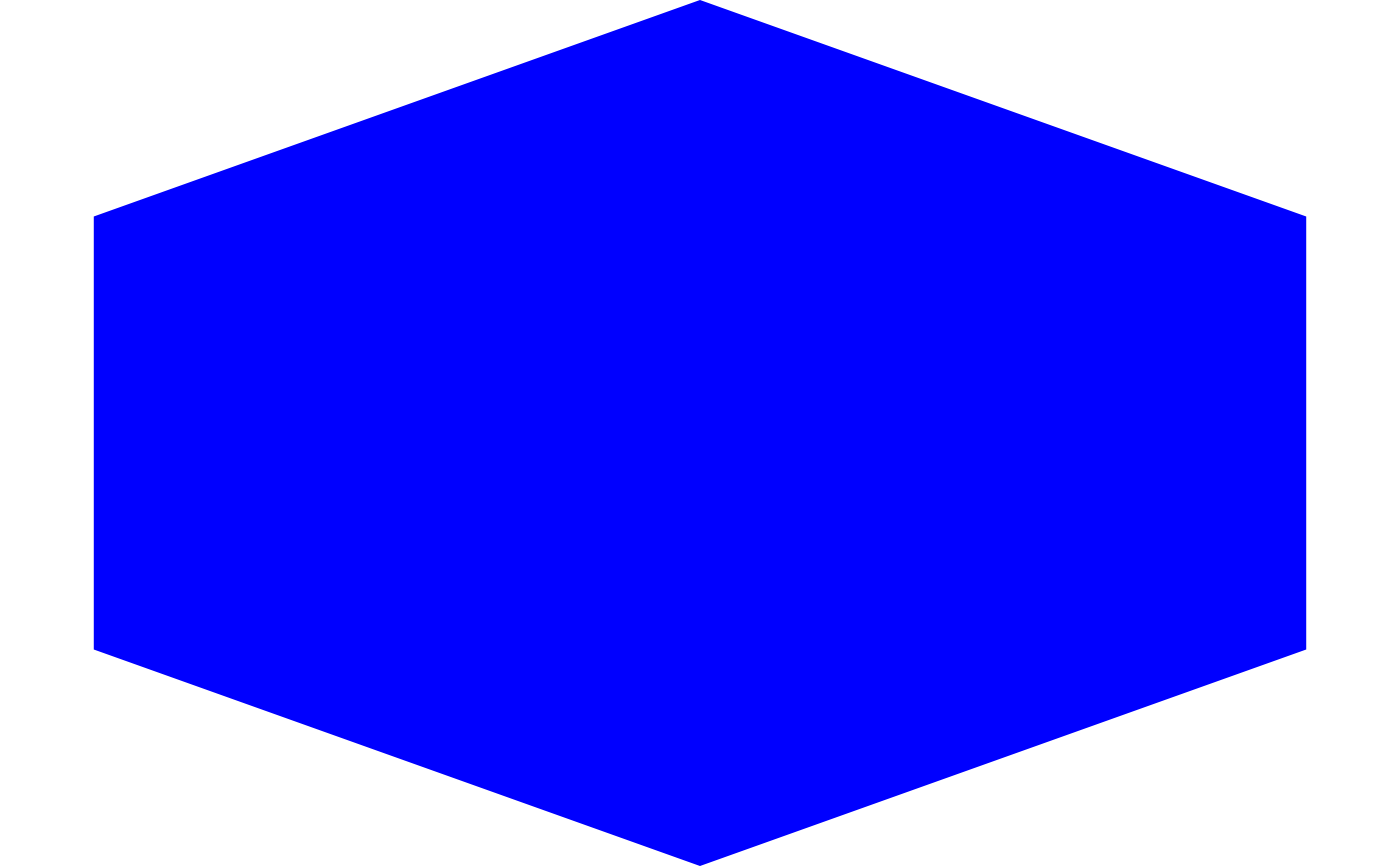
x_hex <- 0.5 + 0.5 * cos(seq(2 * pi / 4, by = 2 * pi / 6, length.out = 6))
y_hex <- 0.5 + 0.5 * sin(seq(2 * pi / 4, by = 2 * pi / 6, length.out = 6))
grid.pattern_fill(x_hex, y_hex, fill = "blue")
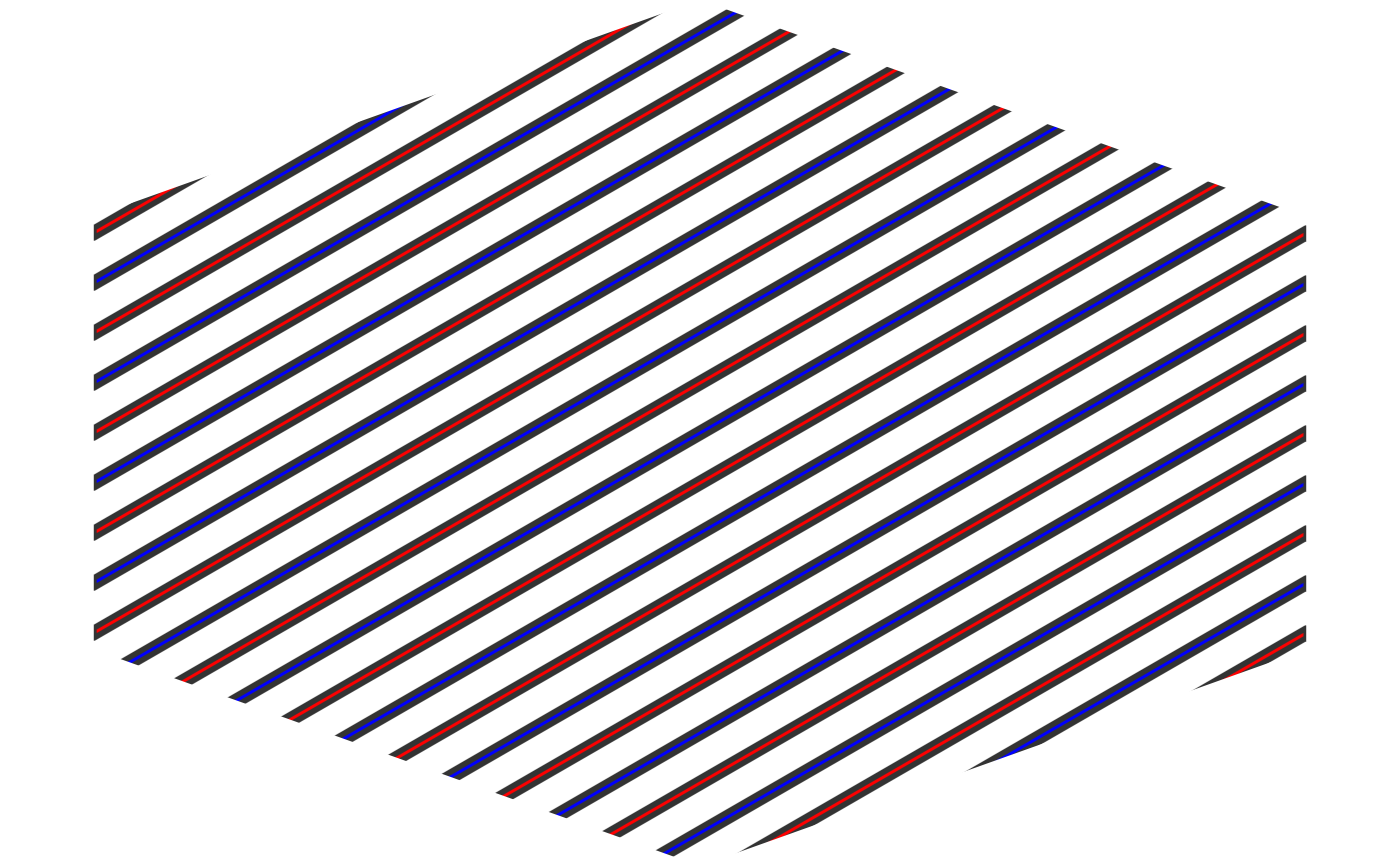
 if (guess_has_R4.1_features("patterns")) {
grid::grid.newpage()
stripe_fill <- patternFill("stripe", fill = c("red", "blue"))
grid.pattern_fill(x_hex, y_hex, fill = stripe_fill)
}
if (guess_has_R4.1_features("patterns")) {
grid::grid.newpage()
stripe_fill <- patternFill("stripe", fill = c("red", "blue"))
grid.pattern_fill(x_hex, y_hex, fill = stripe_fill)
}