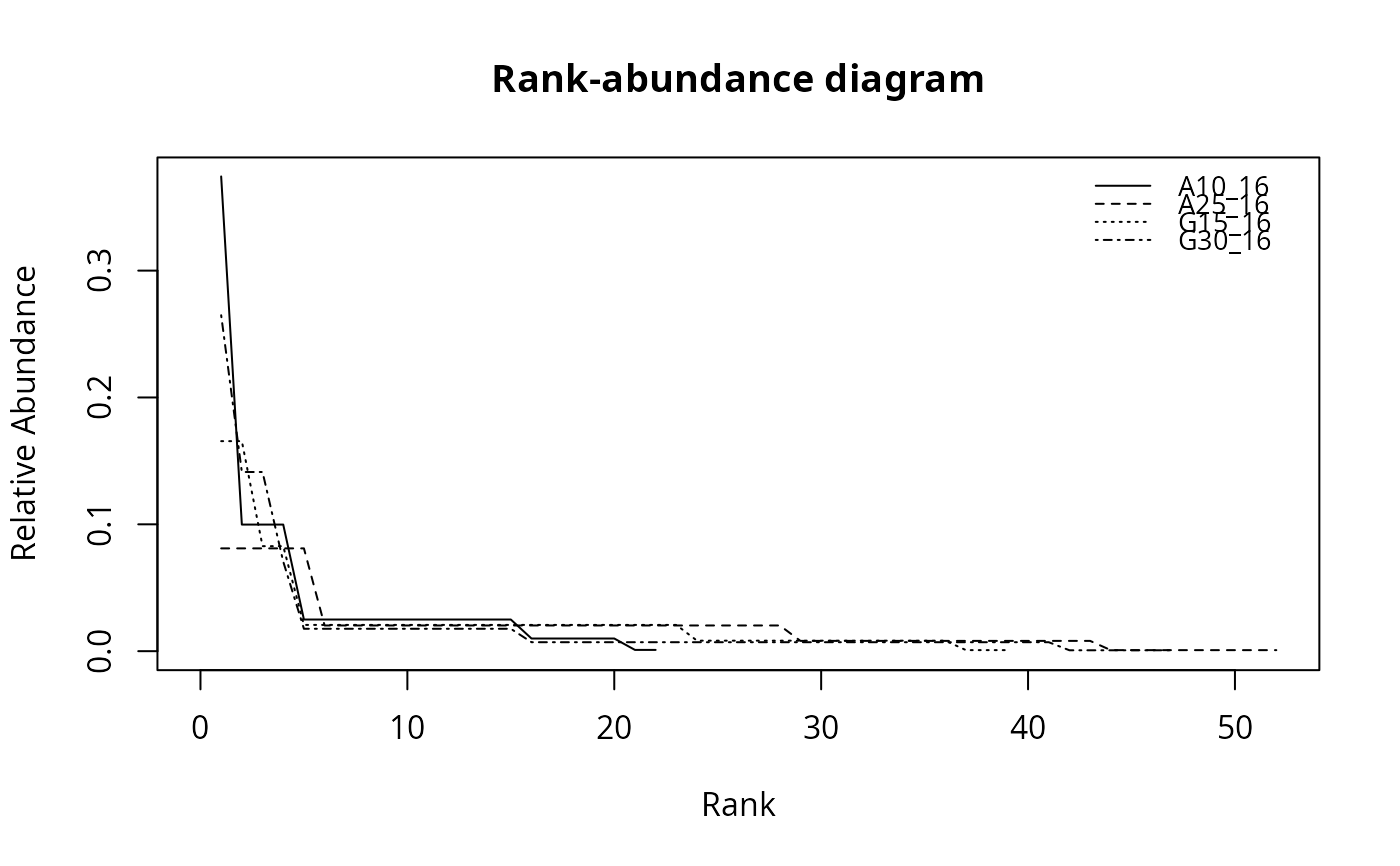
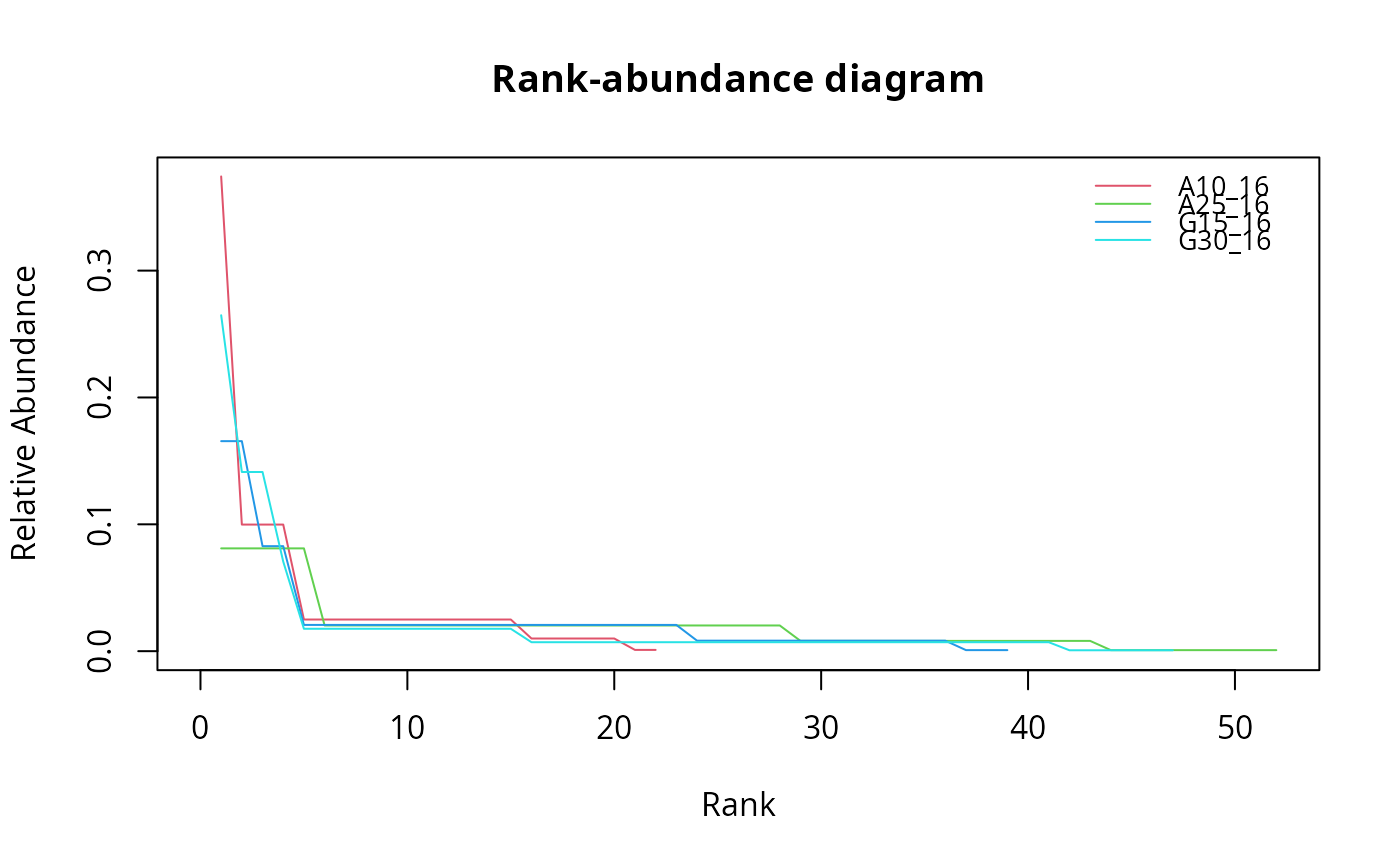
This function draws multiple rank-abundance curves for selected samples into one diagram.
If you wish to draw a simple rank-abundance curve see racurve.
Details
Rank abundance curves or Whittaker plots (see Whittaker 1965) are used to display relative species abundance as biodiversity component. They are a means to visualize species richness and species evenness.
The axes of the diagram will be scaled according automatically. As the line type is used to differentiate between samples, a maximum of 6 curves per diagram is feasible in black/white mode.
References
Whittaker, R. H. (1965). Dominance and Diversity in Land Plant Communities: Numerical relations of species express the importance of competition in community function and evolution. Science 147 : 250-260. doi:10.1126/science.147.3655.250
See also
racurve for a simple curve and rankabundance from package BiodiversityR for a more sophisticated function