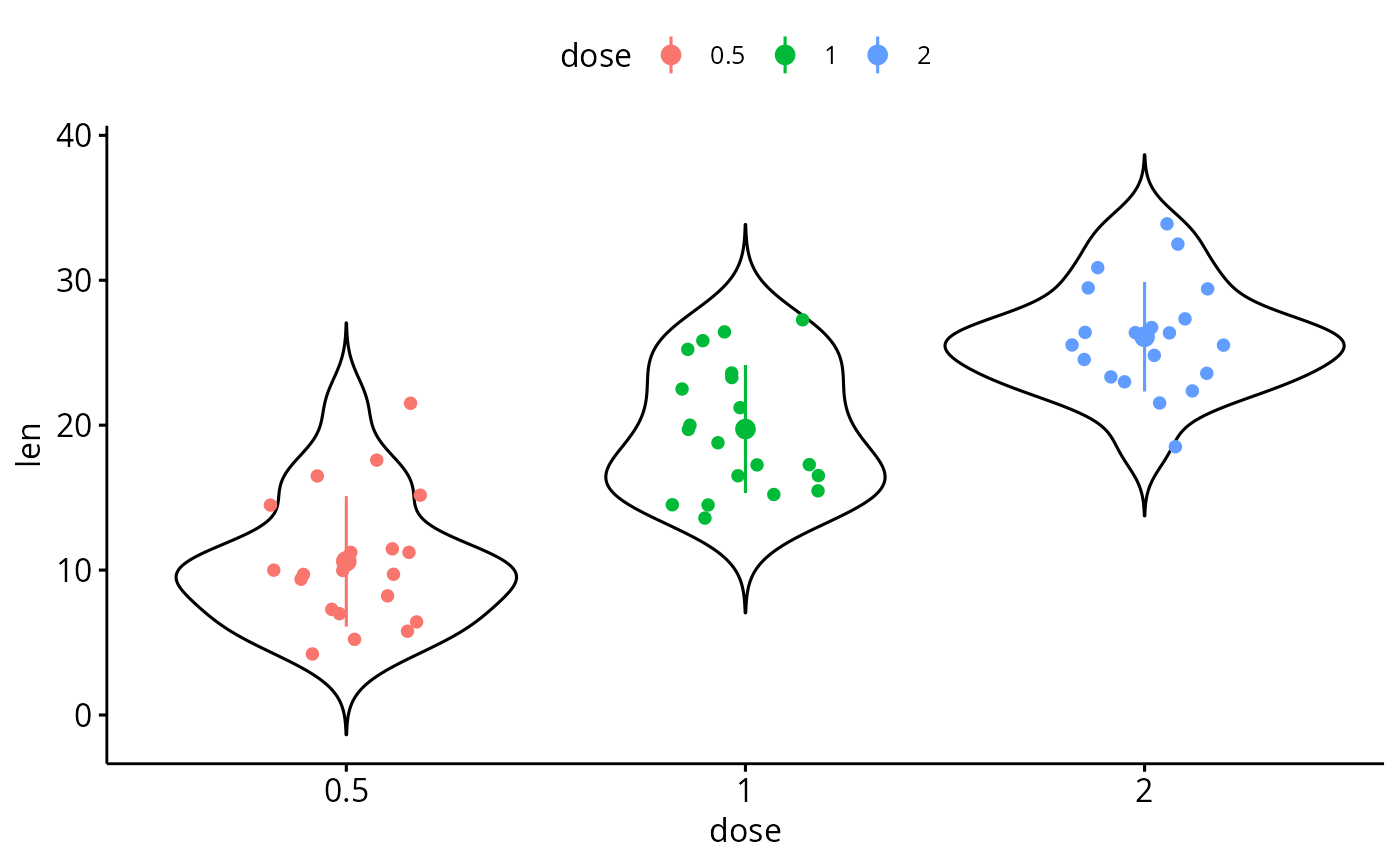
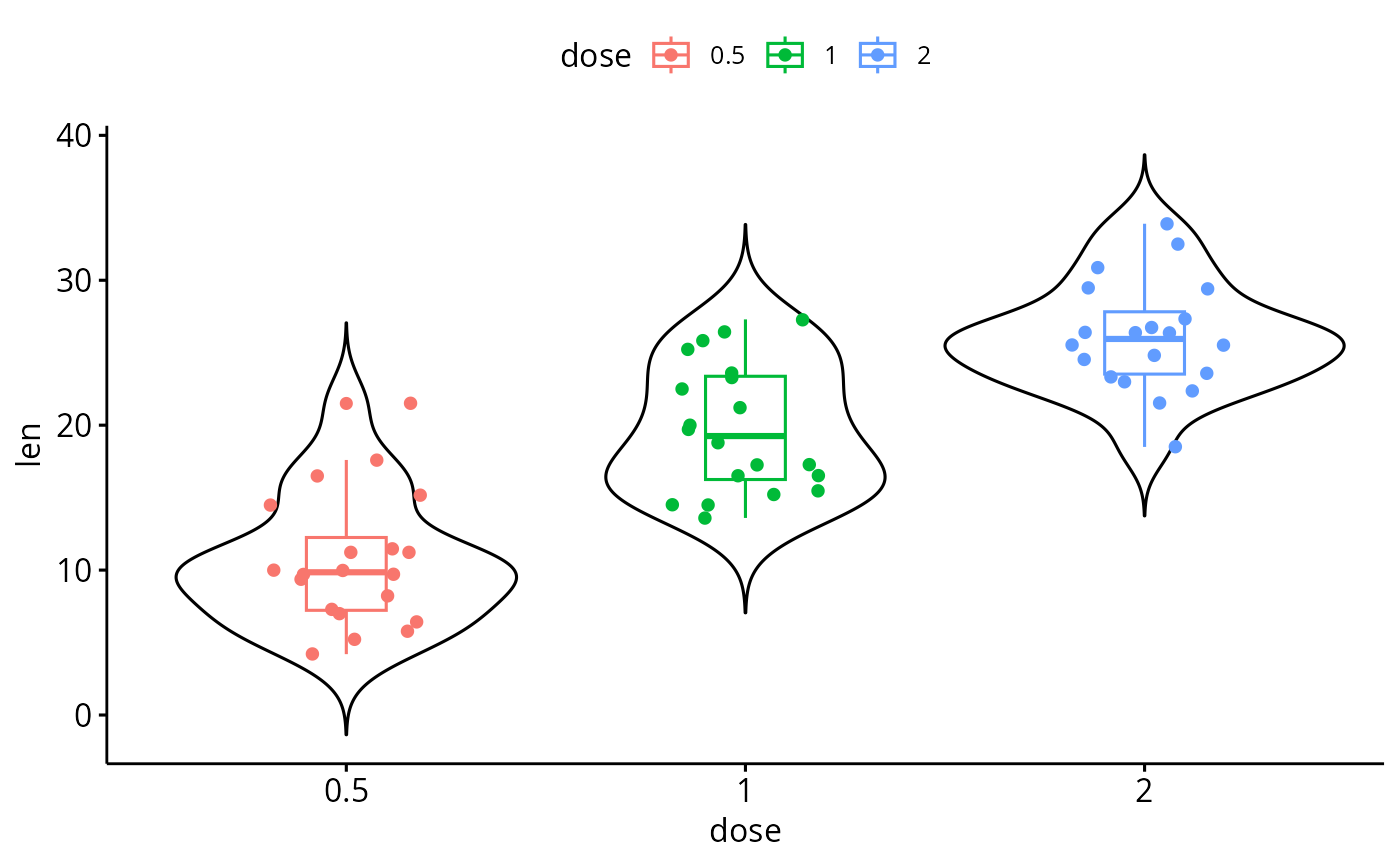
Add summary statistics or a geometry onto a ggplot.
Usage
ggadd(
  p,
  add = NULL,
  color = "black",
  fill = "white",
  group = 1,
  width = 1,
  shape = 19,
  size = NULL,
  alpha = 1,
  jitter = 0.2,
  seed = 123,
  binwidth = NULL,
  dotsize = size,
  linetype = 1,
  linewidth = size,
  show.legend = NA,
  error.plot = "pointrange",
  ci = 0.95,
  outliers = TRUE,
  outlier.shape = 19,
  data = NULL,
  position = position_dodge(0.8),
  p_geom = ""
)
Arguments
- p
a ggplot
- add
character vector specifying other plot elements to be added. Allowed values are one or the combination of: "none", "dotplot", "jitter", "boxplot", "point", "mean", "mean_se", "mean_sd", "mean_ci", "mean_range", "median", "median_iqr", "median_hilow", "median_q1q3", "median_mad", "median_range".
- color
point or outline color.
- fill
fill color. Used only when
error.plot = "crossbar".- group
grouping variable. Allowed values are 1 (for one group) or a character vector specifying the name of the grouping variable. Used only for adding statistical summary per group.
- width
numeric value between 0 and 1 specifying bar or box width. Example width = 0.8. Used only when
error.plotis one of c("crossbar", "errorbar").- shape
point shape. Allowed values can be displayed using the function
show_point_shapes().- size
numeric value in [0-1] specifying point and line size.
- alpha
numeric value specifying fill color transparency. Value should be in [0, 1], where 0 is full transparency and 1 is no transparency.
- jitter
a numeric value specifying the amount of jittering. Used only when
addcontains "jitter".- seed
A random seed to make the jitter reproducible. Default is `123`. Useful if you need to apply the same jitter twice, e.g., for a point and a corresponding label. The random seed is reset after jittering. If `NA`, the seed is initialized with a random value; this makes sure that two subsequent calls start with a different seed. Use NULL to use the current random seed and also avoid resetting (the behaviour of ggplot 2.2.1 and earlier).
- binwidth
numeric value specifying bin width. use value between 0 and 1 when you have a strong dense dotplot. For example binwidth = 0.2. Used only when
addcontains "dotplot".- dotsize
as
sizebut applied only to dotplot.- linetype
line type.
- linewidth
numeric value in [0-1] specifying line width. Used only when
addcontains "line" or for adding error bars. Default issize.- show.legend
logical. Should this layer be included in the legends? NA, the default, includes if any aesthetics are mapped.
FALSEnever includes, and TRUE always includes. It can also be a named logical vector to finely select the aesthetics to display.- error.plot
plot type used to visualize error. Allowed values are one of
c("pointrange", "linerange", "crossbar", "errorbar", "upper_errorbar",
"lower_errorbar", "upper_pointrange", "lower_pointrange", "upper_linerange",
"lower_linerange")
. Default value is "pointrange".- ci
the percent range of the confidence interval (default is 0.95).
- outliers
logical. If TRUE (default), outliers are displayed in boxplots. If FALSE, outliers are not displayed.
- outlier.shape
numeric value specifying the shape of outliers in boxplots. Default is 19 (filled circle). if set to NA, outliers are not displayed.
- data
a
data.frameto be displayed. IfNULL, the default, the data is inherited from the plot data as specified in the call to ggplot.- position
position adjustment, either as a string, or the result of a call to a position adjustment function. Used to adjust position for multiple groups.
- p_geom
the geometry of the main plot. Ex: p_geom = "geom_line". If NULL, the geometry is extracted from p. Used only by ggline().