The geometry "geom_point_s" provides a super set of the capabilities of
geom geom_point from package 'ggplot2' by allowing
plotting of arrows or segments joining the original position of displaced observations
to their current position rendered as points or graphic symbols. The most
common use is to demonstrate the action of different position functions. It
can be also used to highlight observations.
geom_point_s(
  mapping = NULL,
  data = NULL,
  stat = "identity",
  position = "identity",
  ...,
  nudge_x = 0,
  nudge_y = 0,
  move.point = TRUE,
  arrow = grid::arrow(length = unit(1/3, "lines"), ends = "first"),
  default.colour = "black",
  default.color = default.colour,
  colour.target = "point",
  color.target = colour.target,
  default.alpha = NA,
  alpha.target = "all",
  add.segments = TRUE,
  box.padding = 0.25,
  point.padding = 1e-06,
  segment.linewidth = 0.5,
  min.segment.length = 0,
  na.rm = FALSE,
  show.legend = NA,
  inherit.aes = TRUE
)
Arguments
- mapping
Set of aesthetic mappings created by
aes. If specified andinherit.aes = TRUE(the default), is combined with the default mapping at the top level of the plot. You only need to supplymappingif there isn't a mapping defined for the plot.- data
A data frame. If specified, overrides the default data frame defined at the top level of the plot.
- stat
The statistical transformation to use on the data for this layer, as a string.
- position
Position adjustment, either as a string, or the result of a call to a position adjustment function.
- ...
other arguments passed on to
layer. There are three types of arguments you can use here:Aesthetics: to set an aesthetic to a fixed value, like
colour = "red"orsize = 3.Other arguments to the layer, for example you override the default
statassociated with the layer.Other arguments passed on to the stat.
- nudge_x, nudge_y
Horizontal and vertical adjustments to nudge the starting position of each text label. The units for
nudge_xandnudge_yare the same as for the data units on the x-axis and y-axis.- move.point
logical If
TRUEthe point is drawn at the nudged position while ifFALSEthe point is drawn at the original position.- arrow
specification for arrow heads, as created by
arrow- default.colour, default.color
A colour definition to use for elements not targeted by the colour aesthetic.
- colour.target, color.target
A character string, one of
"all","point"and"segment"or"none".- default.alpha
numeric in [0..1] A transparency value to use for elements not targeted by the alpha aesthetic.
- alpha.target
A character string, one of
"all","segment","point", or"none".- add.segments
logical Display connecting segments or arrows between original positions and displaced ones if both are available.
- box.padding, point.padding
numeric By how much each end of the segments should shortened in mm.
- segment.linewidth
numeric Width of the segments or arrows in mm.
- min.segment.length
numeric Segments shorter that the minimum length are not rendered, in mm.
- na.rm
If
FALSE(the default), removes missing values with a warning. IfTRUEsilently removes missing values.- show.legend
logical. Should this layer be included in the legends?
NA, the default, includes if any aesthetics are mapped.FALSEnever includes, andTRUEalways includes.- inherit.aes
If
FALSE, overrides the default aesthetics, rather than combining with them. This is most useful for helper functions that define both data and aesthetics and shouldn't inherit behaviour from the default plot specification, e.g.borders.
Value
A plot layer instance.
Details
The plotting of segments is similar in idea to that implemented in
geom_text_repel and relies on position functions
that rename instead of only replacing the original x and y
coordinates from the data object.
By default this geom uses position_nudge_center which is backwards
compatible with position_nudge but provides additional control
on the direction of the nudging.
Note
The insets are stored nested within the main ggplot object and contain their own copy of the data, and are rendered as grid grobs as normal ggplots at the time the main ggplot is rendered. They can have different themes.
Use annotate as redefined in 'ggpp' when adding insets
as annotations (automatically available unless 'ggpp' is not attached).
annotate cannot be used with the npcx and
npcy pseudo-aesthetics.
Position functions
Many layer functions from package 'ggpp' are
designed to work seamlessly with position functions that keep, rather than
discard, the original x and y positions in data when
computing a new displaced position. See position_nudge_keep,
position_dodge_keep, position_jitter_keep,
position_nudge_center, position_nudge_line,
position_nudge_to, position_dodgenudge,
position_jitternudge, and position_stacknudge
for examples and details of their use.
See also
Examples
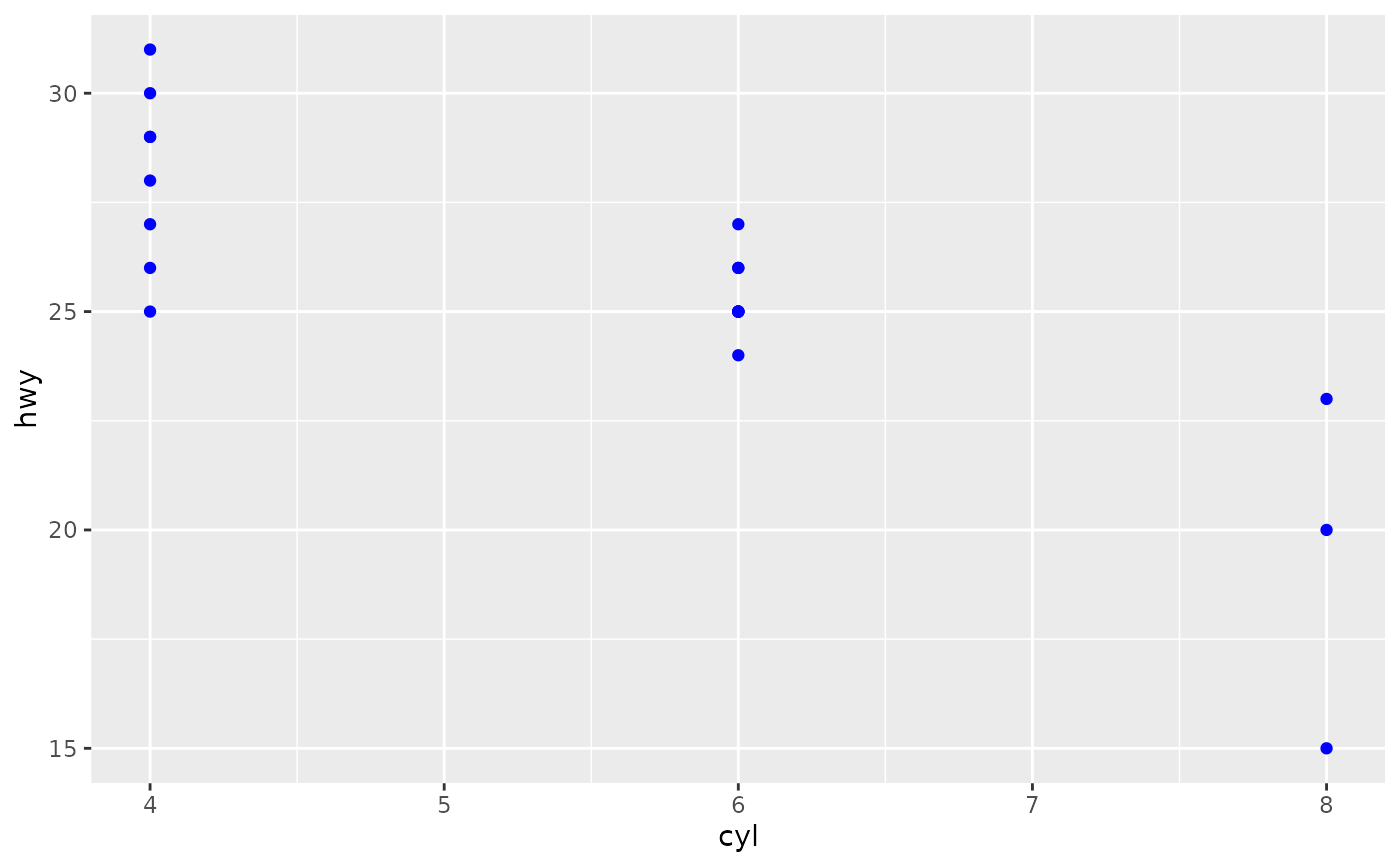
# Same output as with geom_point()
ggplot(mpg[1:20, ],
aes(cyl, hwy)) +
geom_point_s(colour = "blue")
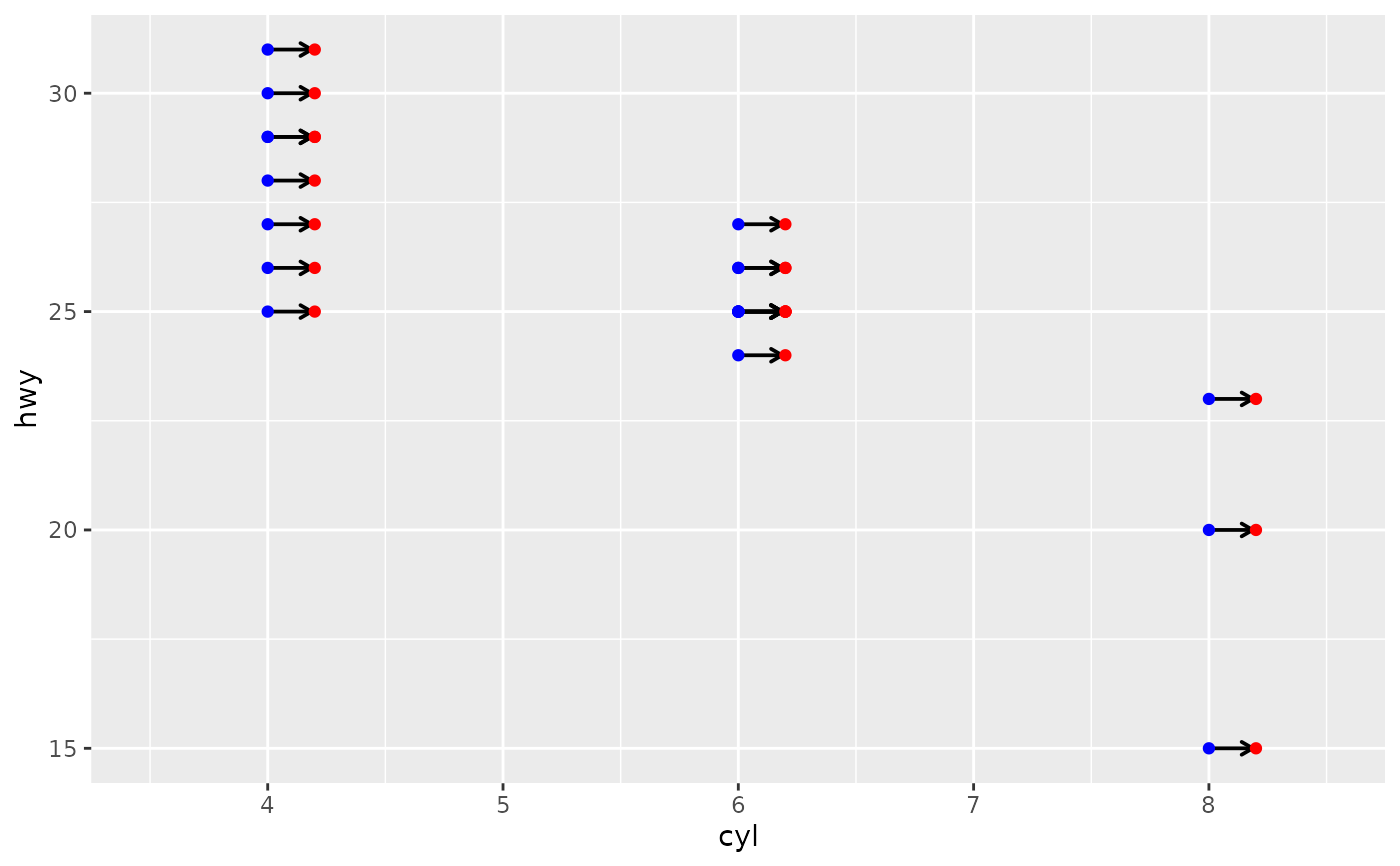
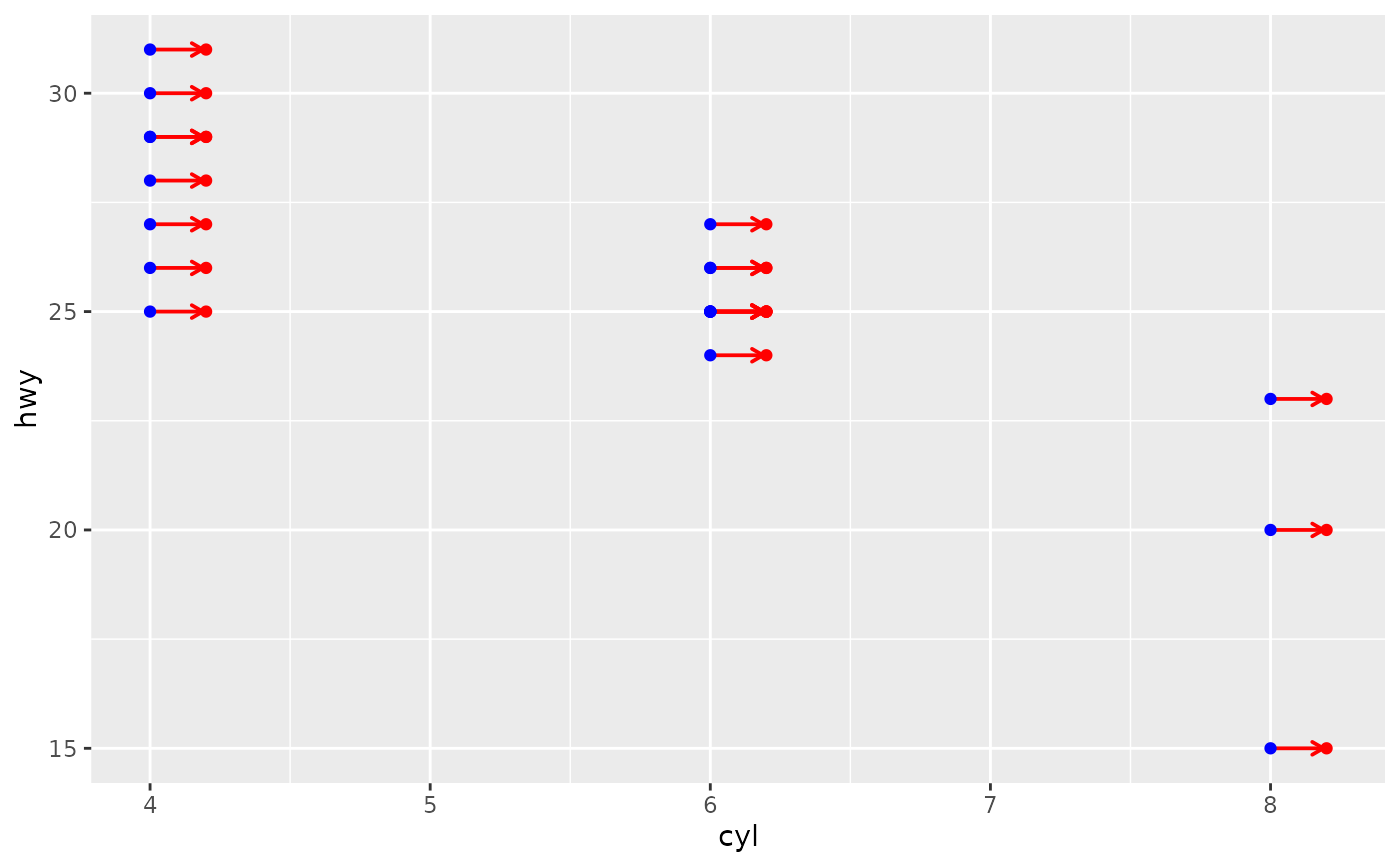
 # with segment drawn after nudging
ggplot(mpg[1:20, ],
aes(cyl, hwy, label = drv)) +
geom_point_s(position = position_nudge_keep(x = 0.2),
colour = "red") +
geom_point_s(colour = "blue") +
expand_limits(x = c(3.5, 8.5))
# with segment drawn after nudging
ggplot(mpg[1:20, ],
aes(cyl, hwy, label = drv)) +
geom_point_s(position = position_nudge_keep(x = 0.2),
colour = "red") +
geom_point_s(colour = "blue") +
expand_limits(x = c(3.5, 8.5))
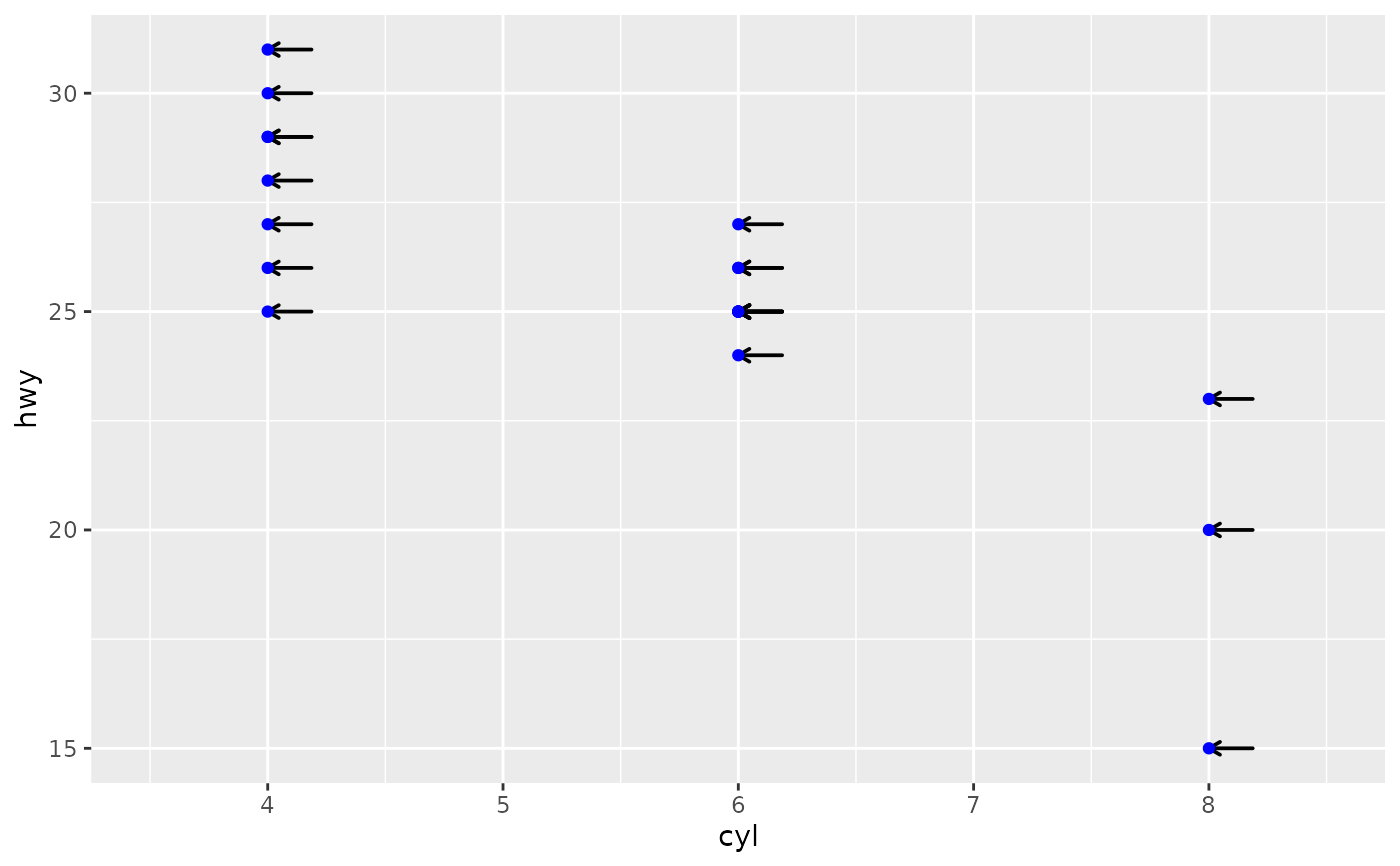
 ggplot(mpg[1:20, ],
aes(cyl, hwy, label = drv)) +
geom_point_s(position = position_nudge_keep(x = 0.2),
colour = "blue",
move.point = FALSE) +
expand_limits(x = c(3.5, 8.5))
ggplot(mpg[1:20, ],
aes(cyl, hwy, label = drv)) +
geom_point_s(position = position_nudge_keep(x = 0.2),
colour = "blue",
move.point = FALSE) +
expand_limits(x = c(3.5, 8.5))
 # with segment drawn after nudging
ggplot(mpg[1:20, ],
aes(cyl, hwy, label = drv)) +
geom_point_s(position = position_nudge_keep(x = 0.2),
colour = "red",
colour.target = "all") +
geom_point_s(colour = "blue")
# with segment drawn after nudging
ggplot(mpg[1:20, ],
aes(cyl, hwy, label = drv)) +
geom_point_s(position = position_nudge_keep(x = 0.2),
colour = "red",
colour.target = "all") +
geom_point_s(colour = "blue")
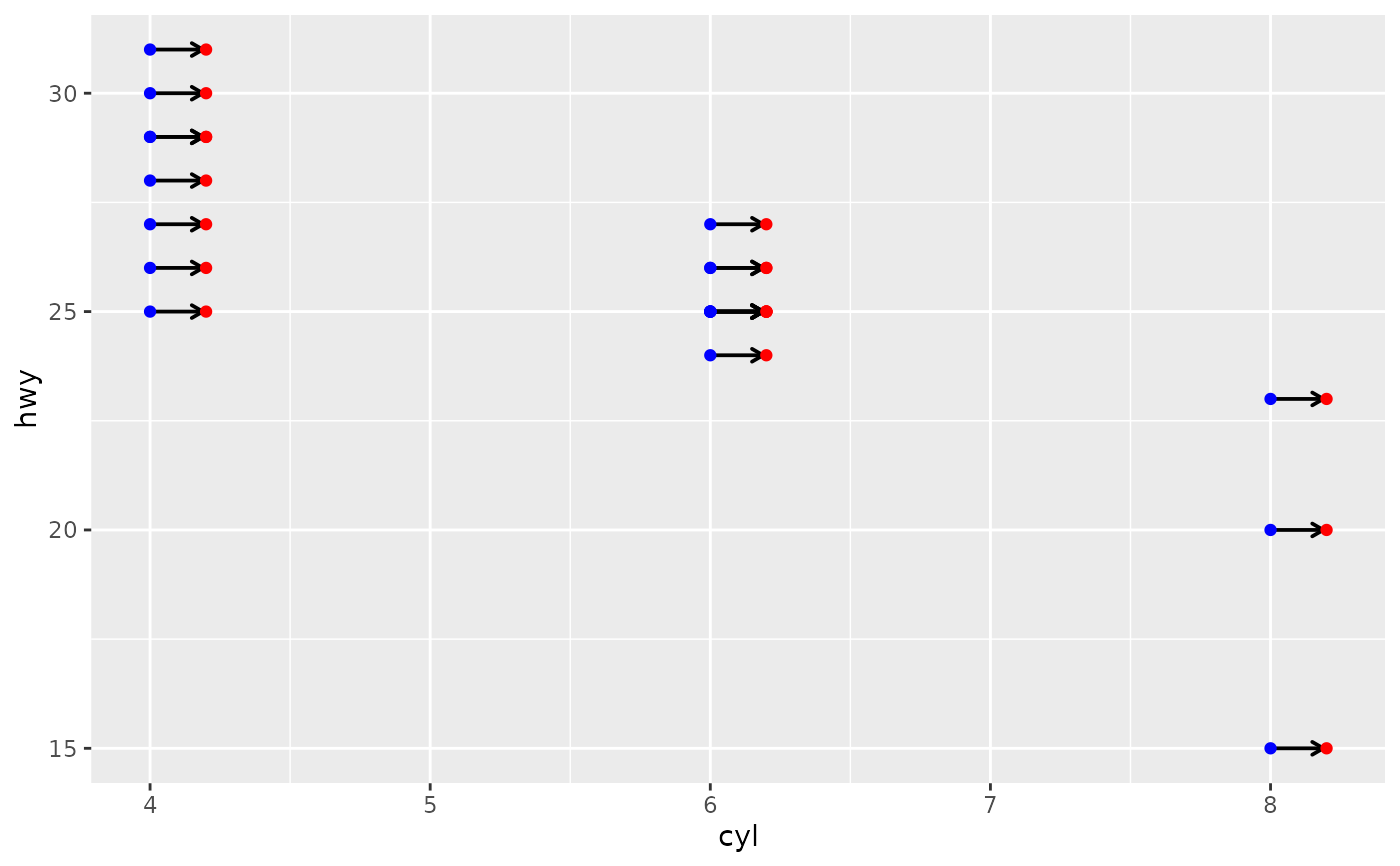
 ggplot(mpg[1:20, ],
aes(cyl, hwy, label = drv)) +
geom_point_s(position = position_nudge_keep(x = 0.2),
colour = "red",
colour.target = "segment") +
geom_point_s(colour = "blue")
ggplot(mpg[1:20, ],
aes(cyl, hwy, label = drv)) +
geom_point_s(position = position_nudge_keep(x = 0.2),
colour = "red",
colour.target = "segment") +
geom_point_s(colour = "blue")
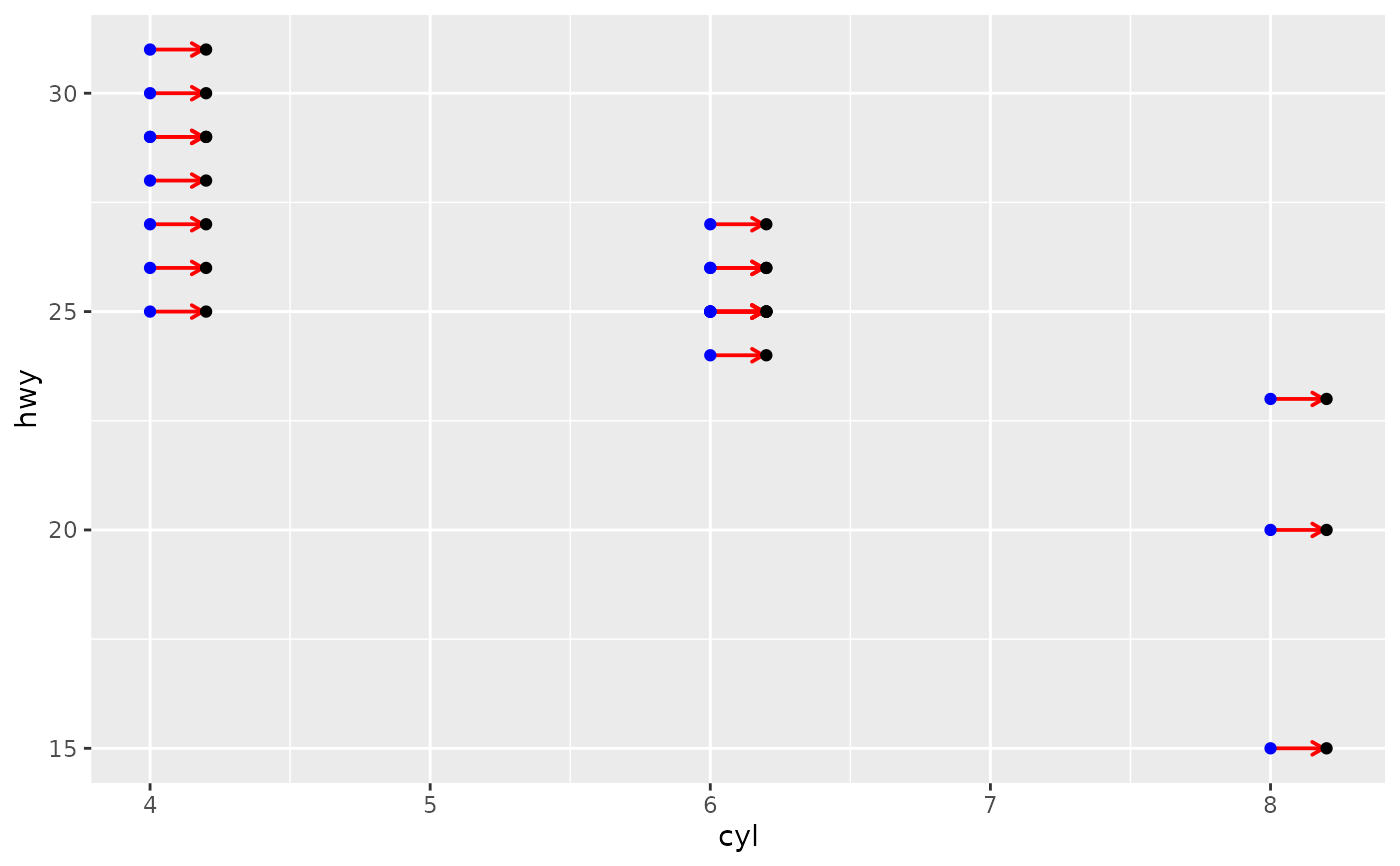 ggplot(mpg[1:20, ],
aes(cyl, hwy, label = drv)) +
geom_point_s(position = position_nudge_keep(x = 0.2),
colour = "red",
colour.target = "point") +
geom_point_s(colour = "blue")
ggplot(mpg[1:20, ],
aes(cyl, hwy, label = drv)) +
geom_point_s(position = position_nudge_keep(x = 0.2),
colour = "red",
colour.target = "point") +
geom_point_s(colour = "blue")
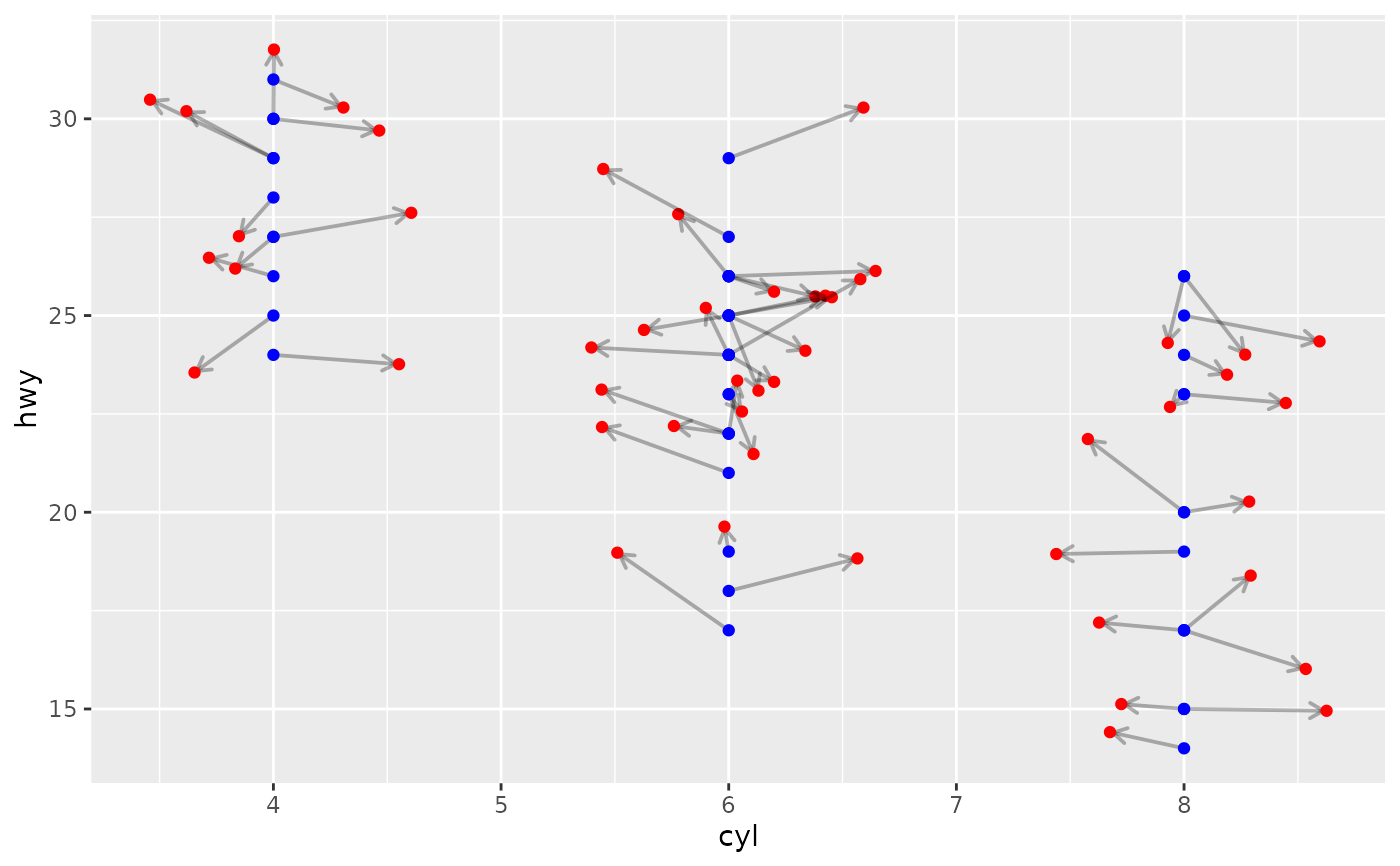
 ggplot(mpg[1:50, ],
aes(cyl, hwy, label = drv)) +
geom_point_s(position = position_jitternudge(width = 0.66, height = 2,
seed = 456,
nudge.from = "jittered",
kept.origin = "original"),
colour = "red",
alpha = 0.3, alpha.target = "segment",
arrow = grid::arrow(length = grid::unit(0.4, "lines"),
ends = "first")) +
geom_point_s(colour = "blue")
ggplot(mpg[1:50, ],
aes(cyl, hwy, label = drv)) +
geom_point_s(position = position_jitternudge(width = 0.66, height = 2,
seed = 456,
nudge.from = "jittered",
kept.origin = "original"),
colour = "red",
alpha = 0.3, alpha.target = "segment",
arrow = grid::arrow(length = grid::unit(0.4, "lines"),
ends = "first")) +
geom_point_s(colour = "blue")