stat_multcomp fits a linear model by default with stats::lm()
but alternatively using other model fit functions. The model is passed to
function glht() from package 'multcomp' to fit Tukey, Dunnet or other
pairwise contrasts and generates labels based on adjusted
P-values.
stat_multcomp(
  mapping = NULL,
  data = NULL,
  geom = NULL,
  position = "identity",
  ...,
  formula = NULL,
  method = "lm",
  method.args = list(),
  contrasts = "Tukey",
  p.adjust.method = NULL,
  small.p = getOption("ggpmisc.small.p", default = FALSE),
  adj.method.tag = 4,
  p.digits = 3,
  label.type = "bars",
  fm.cutoff.p.value = 1,
  mc.cutoff.p.value = 1,
  mc.critical.p.value = 0.05,
  label.y = NULL,
  vstep = NULL,
  output.type = NULL,
  na.rm = FALSE,
  orientation = "x",
  parse = NULL,
  show.legend = FALSE,
  inherit.aes = TRUE
)
Arguments
- mapping
The aesthetic mapping, usually constructed with
aes. Only needs to be set at the layer level if you are overriding the plot defaults.- data
A layer specific dataset, only needed if you want to override the plot defaults.
- geom
The geometric object to use to display the data.
- position
The position adjustment to use for overlapping points on this layer.
- ...
other arguments passed on to
layer. This can include aesthetics whose values you want to set, not map. Seelayerfor more details.- formula
a formula object. Using aesthetic names
xandyinstead of original variable names.- method
function or character If character, "lm" (or its equivalent "aov"), "rlm" or the name of a model fit function are accepted, possibly followed by the fit function's
methodargument separated by a colon (e.g."rlm:M"). If a function different tolm(), it must accept as a minimum a model formula through its first parameter, and have formal parameters nameddata,weights, andmethod, and return a model fit object accepted by functionglht().- method.args
named list with additional arguments.
- contrasts
character vector of length one or a numeric matrix. If character, one of "Tukey" or "Dunnet". If a matrix, one column per level of the factor mapped to
xand one row per pairwise contrast.- p.adjust.method
character As the argument for parameter
typeof functionadjusted()passed as argument to parametertestofsummary.glht. Accepted values are "single-step", "Shaffer", "Westfall", "free", "holm", "hochberg", "hommel", "bonferroni", "BH", "BY", "fdr", "none".- small.p
logical If true, use of lower case p instead of capital P as the symbol for P-value in labels.
- adj.method.tag
numeric, character or function If
numeric, the length in characters of the abbreviation of the method used to adjust p-values. A value of zero, adds no label and a negative value uses as starting point for the abbreviation the word "adjusted". Ifcharacterits value is used as subscript. If afunction, the value used is the value returned by the function when passedp.adjust.methodas its only argument.- p.digits
integer Number of digits after the decimal point to use for \(R^2\) and P-value in labels.
- label.type
character One of "bars", "letters" or "LETTERS", selects how the results of the multiple comparisons are displayed. Only "bars" can be used together with
contrasts = "Dunnet".- fm.cutoff.p.value
numeric [0..1] The P-value for the main effect of factor
xin the ANOVA test for the fitted model above which no pairwise comparisons are computed or labels generated. Be aware that recent literature tends to recommend to consider which testing approach is relevant to the problem at hand instead of requiring the significance of the main effect before applying multiple comparisons' tests. The default value is 1, imposing no restrictions.- mc.cutoff.p.value
numeric [0..1] The P-value for the individual contrasts above which no labelled bars are generated. Default is 1, labelling all pairwise contrasts tested.
- mc.critical.p.value
numeric The critical P-value used for tests when encoded as letters.
- label.y
numeric vector Values in native data units or if
character, one of "top" or "bottom". Recycled if too short and truncated if too long.- vstep
numeric in npc units, the vertical displacement step-size used between labels for different contrasts when
label.type = "bars".- output.type
character One of "expression", "LaTeX", "text", "markdown" or "numeric".
- na.rm
a logical indicating whether NA values should be stripped before the computation proceeds.
- orientation
character Either "x" or "y" controlling the default for
formula. Support fororientationis not yet implemented but is planned.- parse
logical Passed to the geom. If
TRUE, the labels will be parsed into expressions and displayed as described in?plotmath. Default isTRUEifoutput.type = "expression"andFALSEotherwise.- show.legend
logical. Should this layer be included in the legends?
NA, the default, includes if any aesthetics are mapped.FALSEnever includes, andTRUEalways includes.- inherit.aes
If
FALSE, overrides the default aesthetics, rather than combining with them.
Value
A data frame with one row per comparison for label.type =
"bars", or a data frame with one row per factor x level for
label.type = "letters" and for label.type = "LETTERS".
Variables (= columns) as described under Computed variables.
Details
This statistic can be used to automatically annotate a plot with
P-values for pairwise multiple comparison tests, based on
Tukey contrasts (all pairwise), Dunnet contrasts (other levels against the
first one) or a subset of all possible pairwise contrasts. See Meier (2022,
Chapter 3) for an accessible explanation of multiple comparisons and
contrasts with package 'multcomp', of which stat_multcomp() is
mostly a wrapper.
The explanatory variable mapped to the x aesthetic must be a factor as this creates the required grouping. Currently, contrasts that involve more than two levels of a factor, such as the average of two treatment levels against a control level are not supported, mainly because they require a new geometry that I need to design, implement and add to package 'ggpp'.
Two ways of displaying the outcomes are implemented, and are selected by `"bars"`, `"letters"` or `"LETTERS"` as argument to parameter `label.type`. `"letters"` and `"LETTERS"` can be used only with Tukey contrasts, as otherwise the encoding is ambiguous. As too many bars clutter a plot, the maximum number of factor levels supported for `"bars"` together with Tukey contrasts is five, while together with Dunnet contrasts or contrasts defined by a numeric matrix, no limit is imposed.
stat_multcomp() by default generates character labels ready to be
parsed as R expressions but LaTeX (use TikZ device), markdown (use package
'ggtext') and plain text are also supported, as well as numeric values for
user-generated text labels. The value of parse is set automatically
based on output.type, but if you assemble labels that need parsing
from numeric output, the default needs to be overridden. This
statistic only generates annotation labels and segments connecting the
compared factor levels, or letter labels that discriminate significantly
different groups.
Note
R option OutDec is obeyed based on its value at the time the plot
is rendered, i.e., displayed or printed. Set options(OutDec = ",")
for languages like Spanish or French.
Aesthetics
stat_multcomp() understands x and
y, to be referenced in the formula and weight passed
as argument to parameter weights. A factor must be mapped to
x and numeric variables to y, and, if used, to
weight. In addition, the aesthetics understood by the geom
("label_pairwise" is the default for label.type = "bars",
"text" is the default for label.type = "letters" and for
label.type = "LETTERS") are understood and grouping
respected.
Computed variables
If output.type = "numeric" and
label.type = "bars" the returned tibble contains
columns listed below. In all cases if the model fit function used does not return a value,
the label is set to character(0L) and the numeric value to NA.
- x,x.left.tip,x.right.tip
x position, numeric.
- y
y position, numeric.
- coefficients
Delta estimate from pairwise contrasts, numeric.
- contrasts
Contrasts as two levels' ordinal "numbers" separated by a dash, character.
- tstat
t-statistic estimates for the pairwise contrasts, numeric.
- p.value
P-value for the pairwise contrasts.
- fm.method
Set according
methodused.- fm.class
Most derived class of the fitted model object.
- fm.formula
Formula extracted from the fitted model object if available, or the formula argument.
- fm.formula.chr
Formula extracted from the fitted model object if available, or the formula argument, formatted as character.
- mc.adjusted
The method used to adjust the P-values.
- mc.contrast
The type of contrast used for multiple comparisons.
- n
The total number of observations or rows in data.
- default.label
text label, always included, but possibly NA.
If output.type is not "numeric" the returned data frame includes in
addition the following labels:
- stars.label
P-value for the pairwise contrasts encoded as "starts", character.
- p.value.label
P-value for the pairwise contrasts, character.
- delta.label
The coefficient or estimate for the difference between compared pairs of levels.
- t.value.label
t-statistic estimates for the pairwise contrasts, character.
If label.type = "letters" or label.type = "LETTERS" the returned tibble contains
columns listed below.
- x,x.left.tip,x.right.tip
x position, numeric.
- y
y position, numeric.
- critical.p.value
P-value used in pairwise tests, numeric.
- fm.method
Set according
methodused.- fm.class
Most derived class of the fitted model object.
- fm.formula
Formula extracted from the fitted model object if available, or the formula argument.
- fm.formula.chr
Formula extracted from the fitted model object if available, or the formula argument, formatted as character.
- mc.adjusted
The method used to adjust the P-values.
- mc.contrast
The type of contrast used for multiple comparisons.
- n
The total number of observations or rows in data.
- default.label
text label, always included, but possibly NA.
If output.type is not "numeric" the returned data frame includes in
addition the following labels:
- letters.label
Letters that distinguish levels based on significance from multiple comparisons test.
Alternatives
stat_signif() in package 'ggsignif' is
an earlier and independent implementation of pairwise tests.
References
Meier, Lukas (2022) ANOVA and Mixed Models: A Short Introduction Using R. Chapter 3 Contrasts and Multiple Testing. The R Series. Boca Raton: Chapman and Hall/CRC. ISBN: 9780367704209, doi:10.1201/9781003146216 .
See also
This statistic uses the implementation of Tests of General Linear
Hypotheses in function glht. See
summary.glht and p.adjust
for the supported and tests and the references therein for the theory
behind them.
Examples
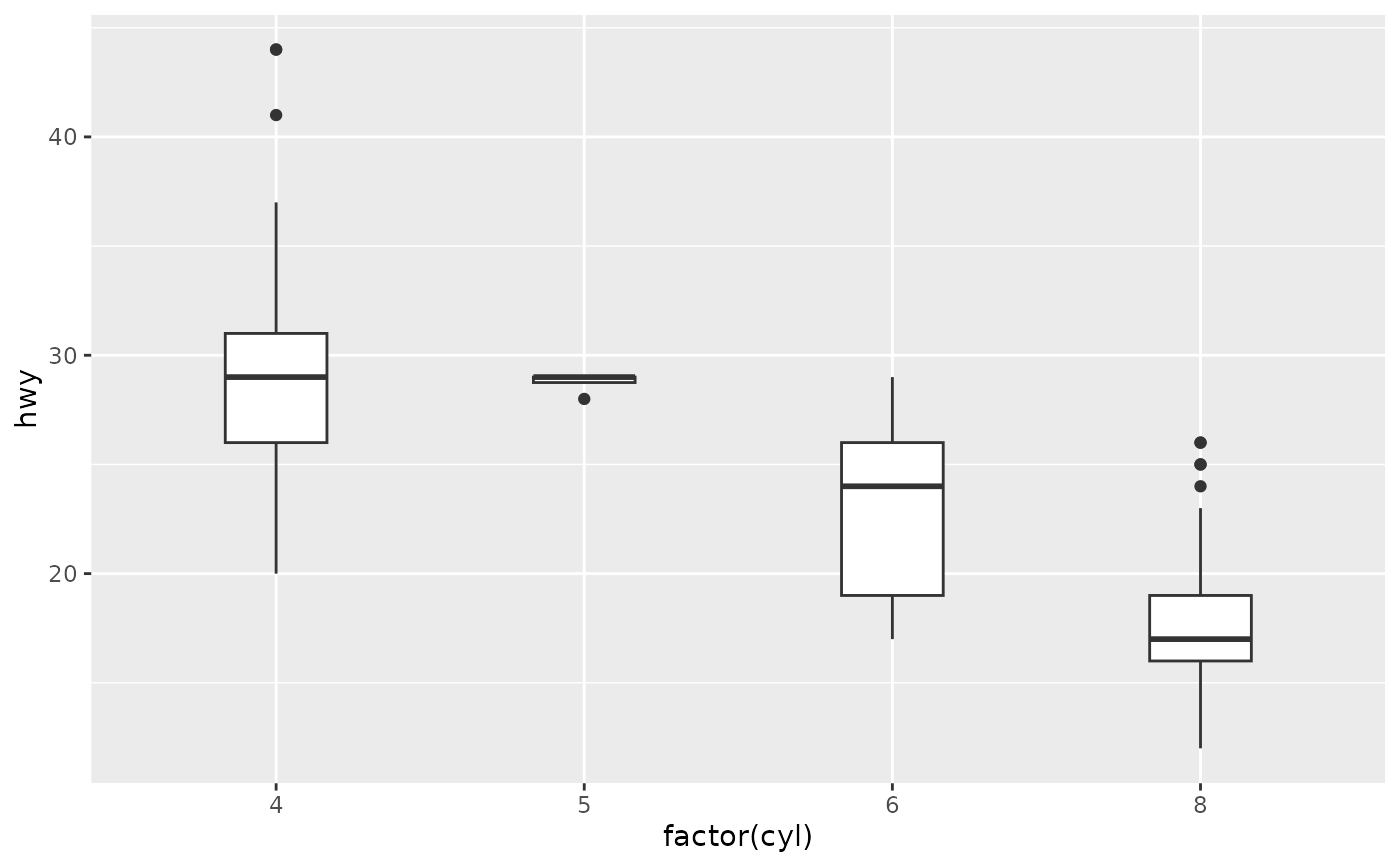
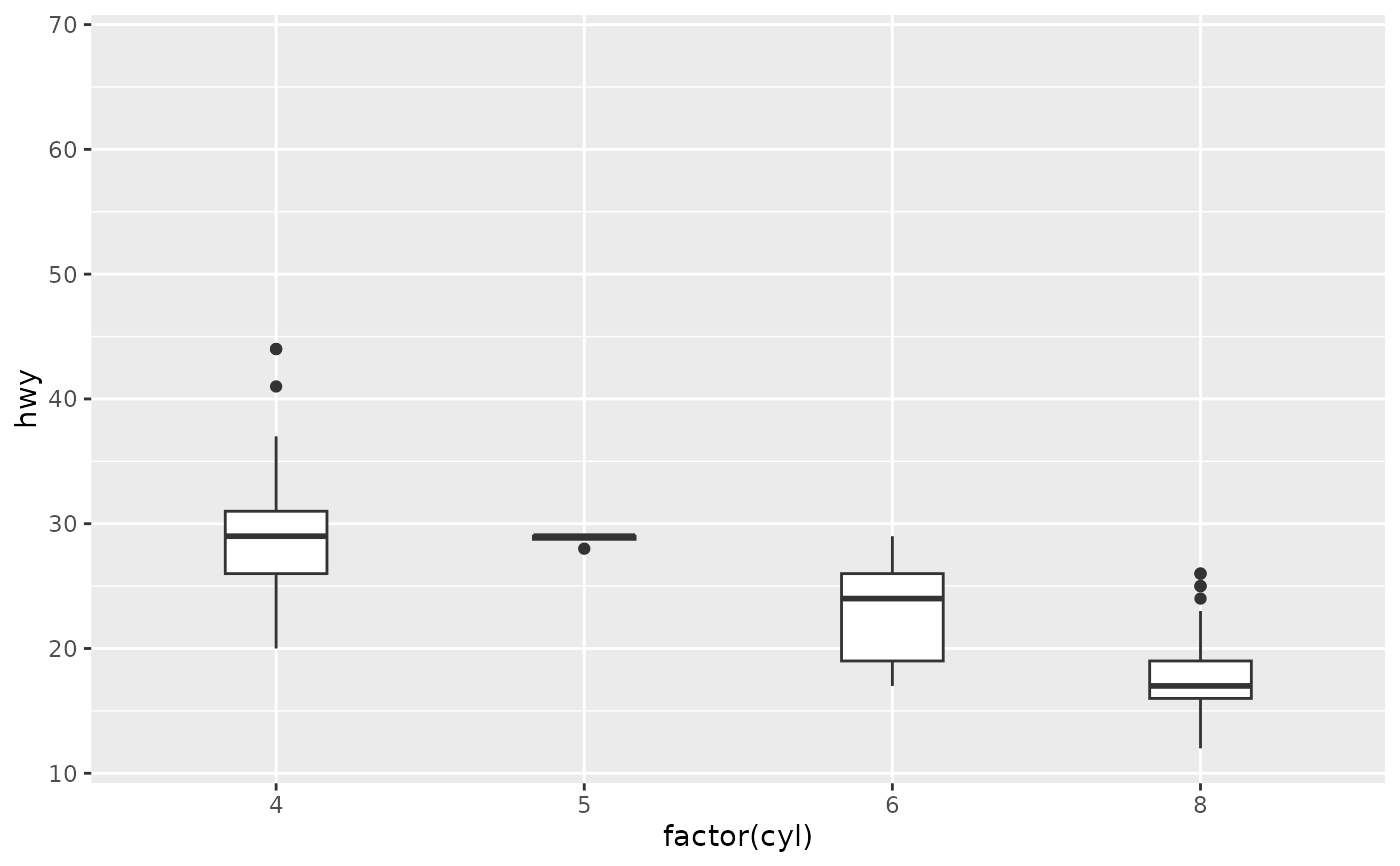
p1 <- ggplot(mpg, aes(factor(cyl), hwy)) +
geom_boxplot(width = 0.33)
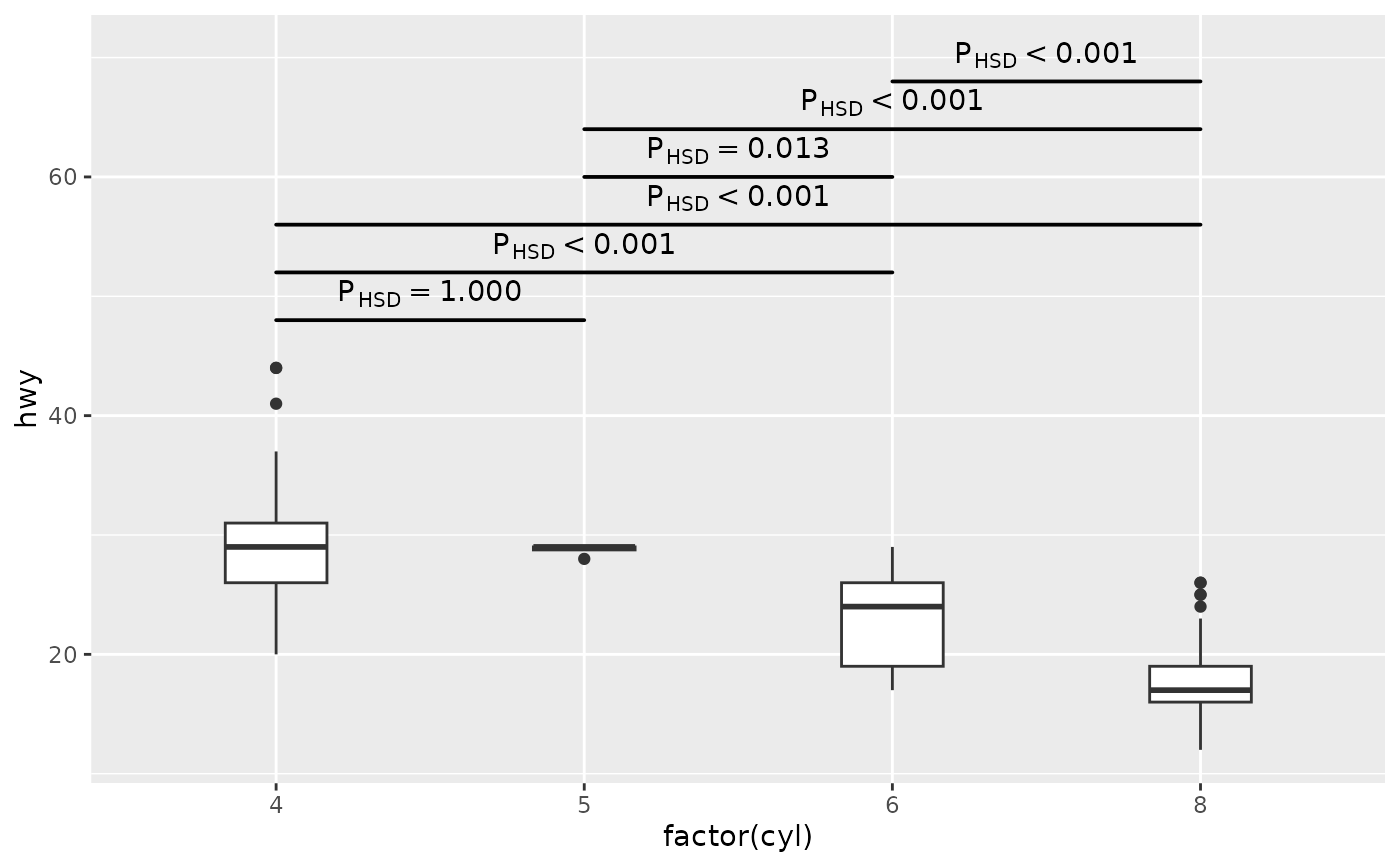
## labeleld bars
p1 +
stat_multcomp()
 p1 +
stat_multcomp(adj.method.tag = 0)
#> Warning: Computation failed in `stat_multcomp()`.
#> Caused by error in `if (...) NULL`:
#> ! argument is of length zero
p1 +
stat_multcomp(adj.method.tag = 0)
#> Warning: Computation failed in `stat_multcomp()`.
#> Caused by error in `if (...) NULL`:
#> ! argument is of length zero
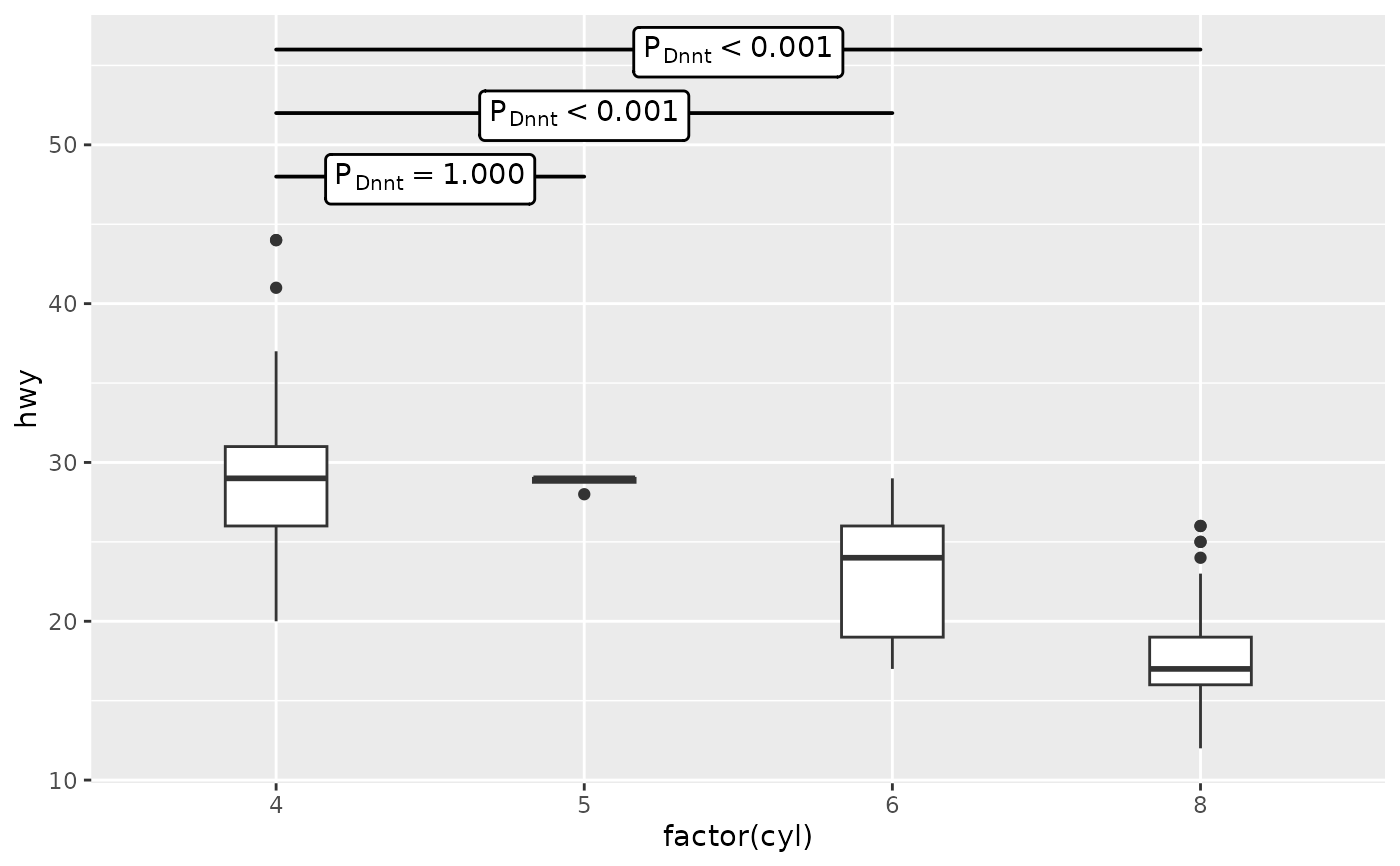
 # test against a control, with first level being the control
# change order of factor levels in data to set the control group
p1 +
stat_multcomp(contrasts = "Dunnet")
# test against a control, with first level being the control
# change order of factor levels in data to set the control group
p1 +
stat_multcomp(contrasts = "Dunnet")
 # arbitrary pairwise contrasts, in arbitrary order
p1 +
stat_multcomp(contrasts = rbind(c(0, 0, -1, 1),
c(0, -1, 1, 0),
c(-1, 1, 0, 0)))
# arbitrary pairwise contrasts, in arbitrary order
p1 +
stat_multcomp(contrasts = rbind(c(0, 0, -1, 1),
c(0, -1, 1, 0),
c(-1, 1, 0, 0)))
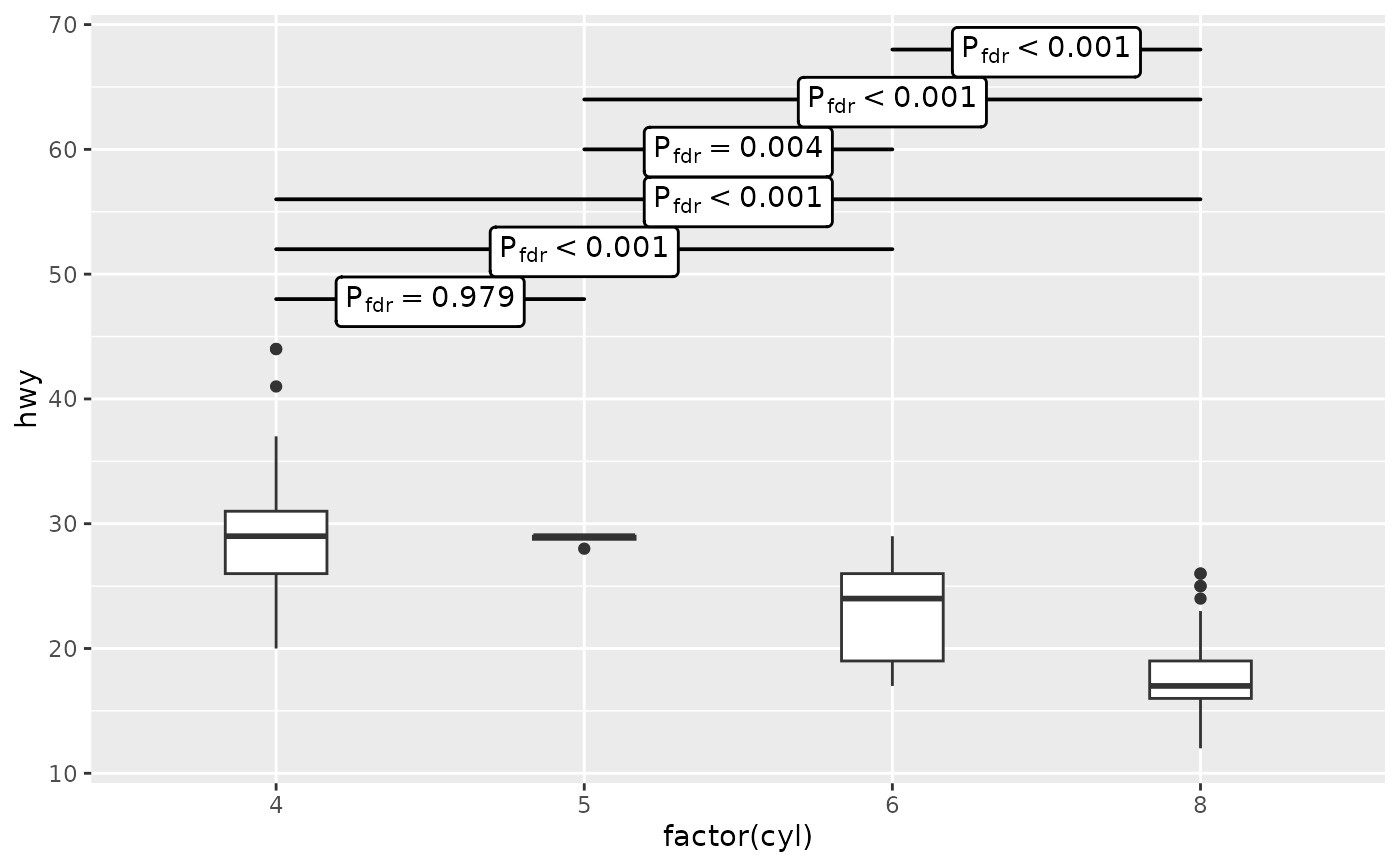
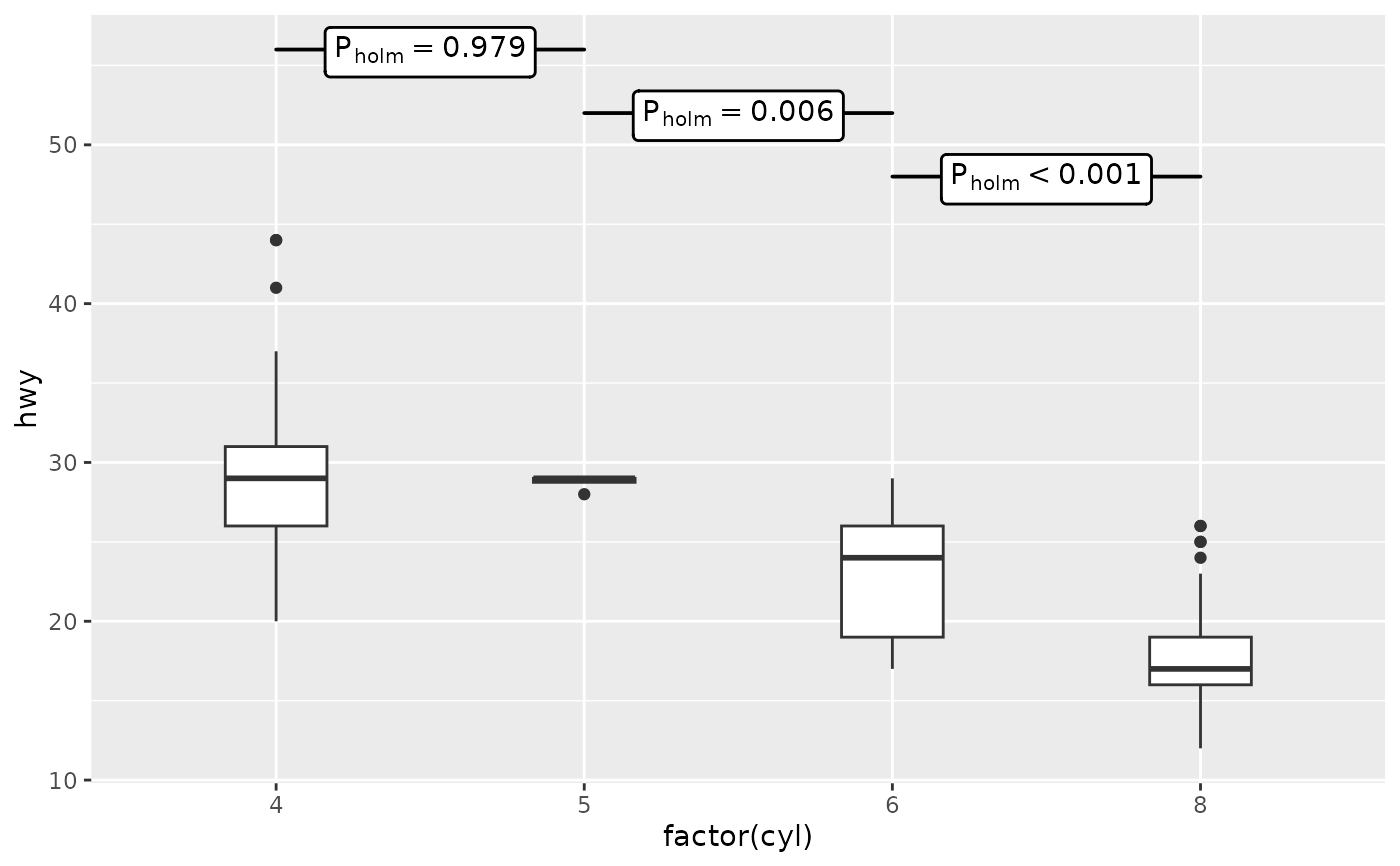 # different methods to adjust the contrasts
p1 +
stat_multcomp(p.adjust.method = "bonferroni")
# different methods to adjust the contrasts
p1 +
stat_multcomp(p.adjust.method = "bonferroni")
 p1 +
stat_multcomp(p.adjust.method = "holm")
p1 +
stat_multcomp(p.adjust.method = "holm")
 p1 +
stat_multcomp(p.adjust.method = "fdr")
p1 +
stat_multcomp(p.adjust.method = "fdr")
 # no correction, useful only for comparison
p1 +
stat_multcomp(p.adjust.method = "none")
# no correction, useful only for comparison
p1 +
stat_multcomp(p.adjust.method = "none")
 # sometimes we need to expand the plotting area
p1 +
stat_multcomp(geom = "text_pairwise") +
scale_y_continuous(expand = expansion(mult = c(0.05, 0.10)))
# sometimes we need to expand the plotting area
p1 +
stat_multcomp(geom = "text_pairwise") +
scale_y_continuous(expand = expansion(mult = c(0.05, 0.10)))
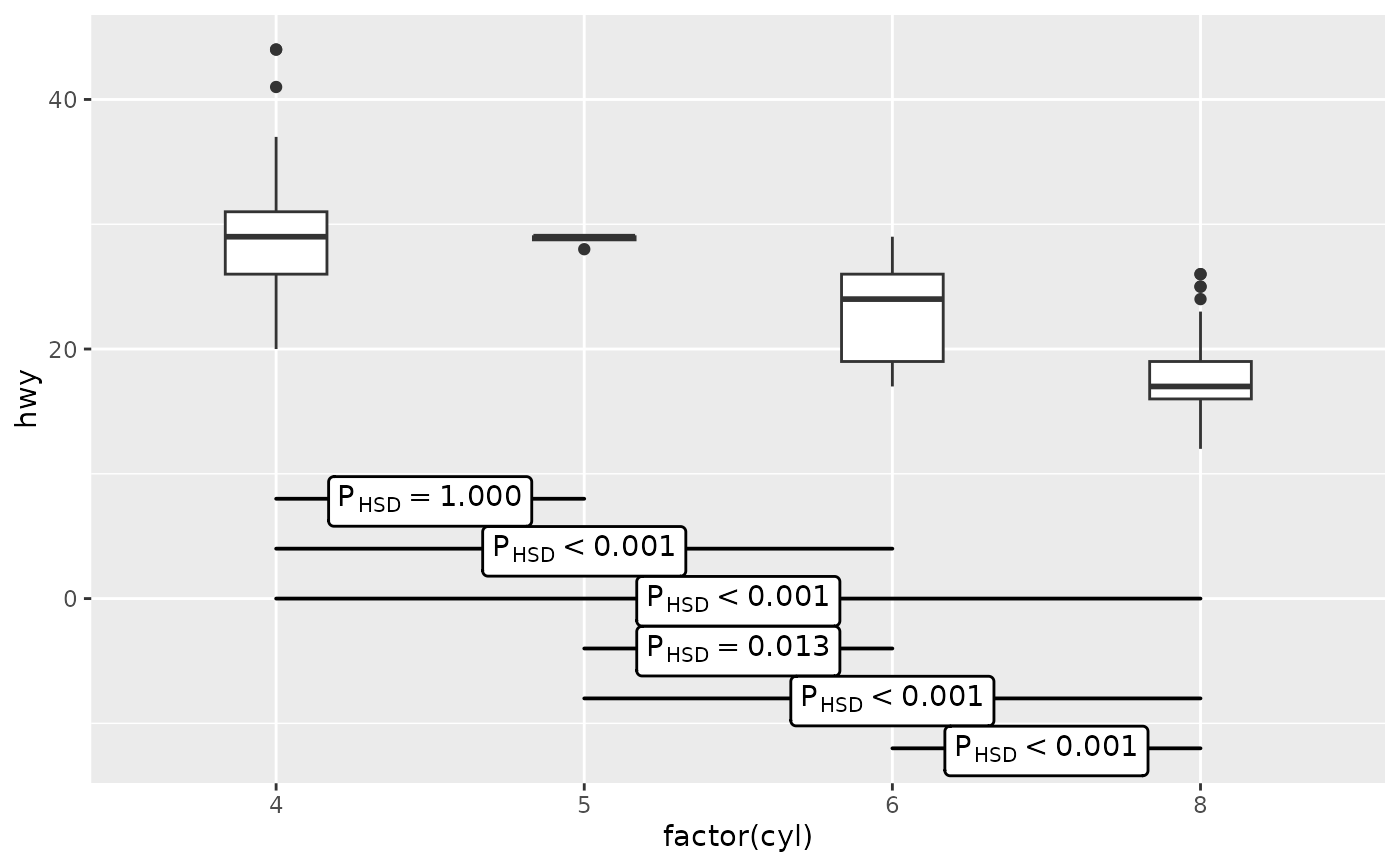
 # position of contrasts' bars (based on scale limits)
p1 +
stat_multcomp(label.y = "bottom")
# position of contrasts' bars (based on scale limits)
p1 +
stat_multcomp(label.y = "bottom")
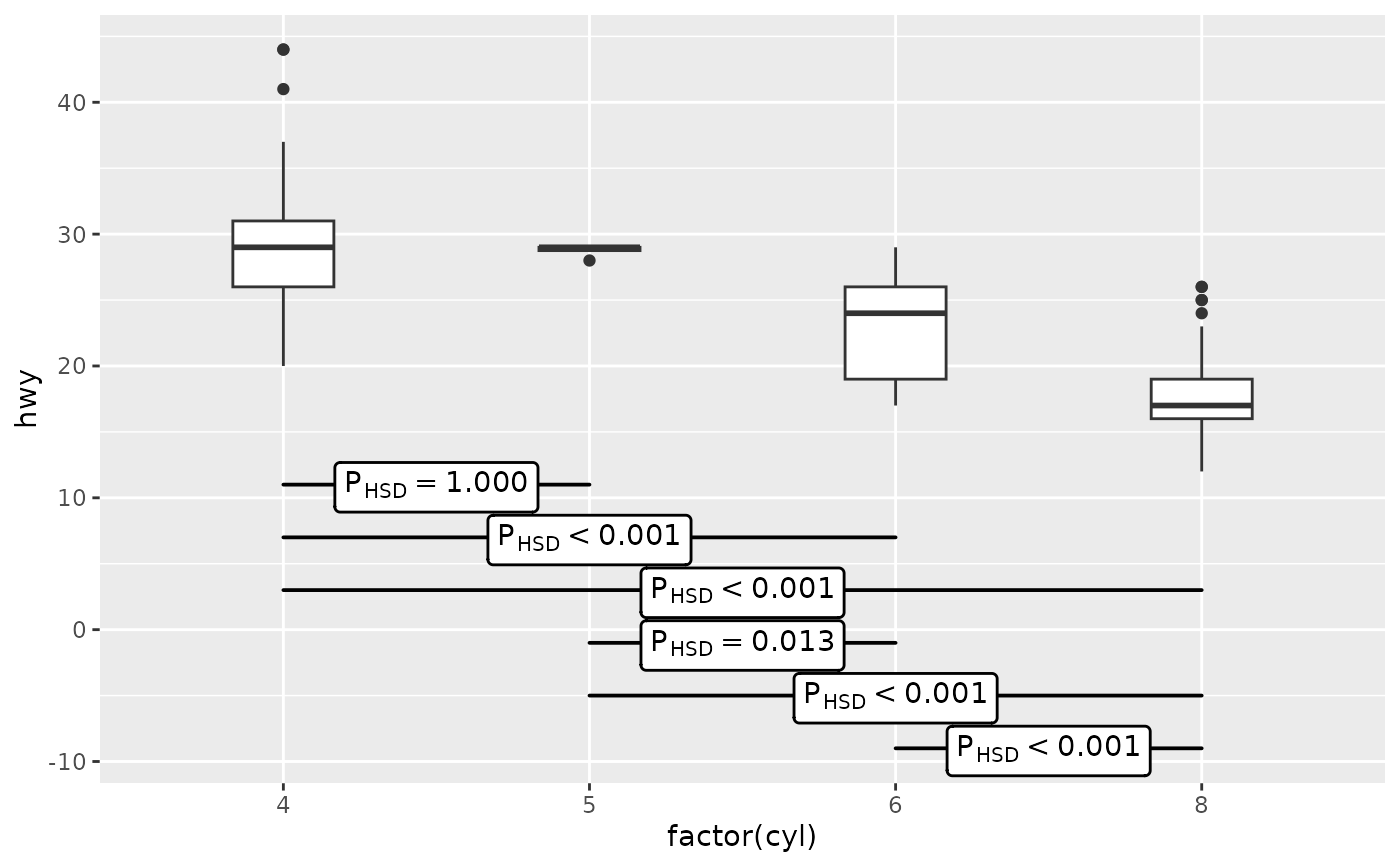
 p1 +
stat_multcomp(label.y = 11)
p1 +
stat_multcomp(label.y = 11)
 # use different labels: difference and P-value from hypothesis tests
p1 +
stat_multcomp(use_label("Delta", "P"),
size = 2.75)
# use different labels: difference and P-value from hypothesis tests
p1 +
stat_multcomp(use_label("Delta", "P"),
size = 2.75)
 # control smallest P-value displayed and number of digits
p1 +
stat_multcomp(p.digits = 4)
# control smallest P-value displayed and number of digits
p1 +
stat_multcomp(p.digits = 4)
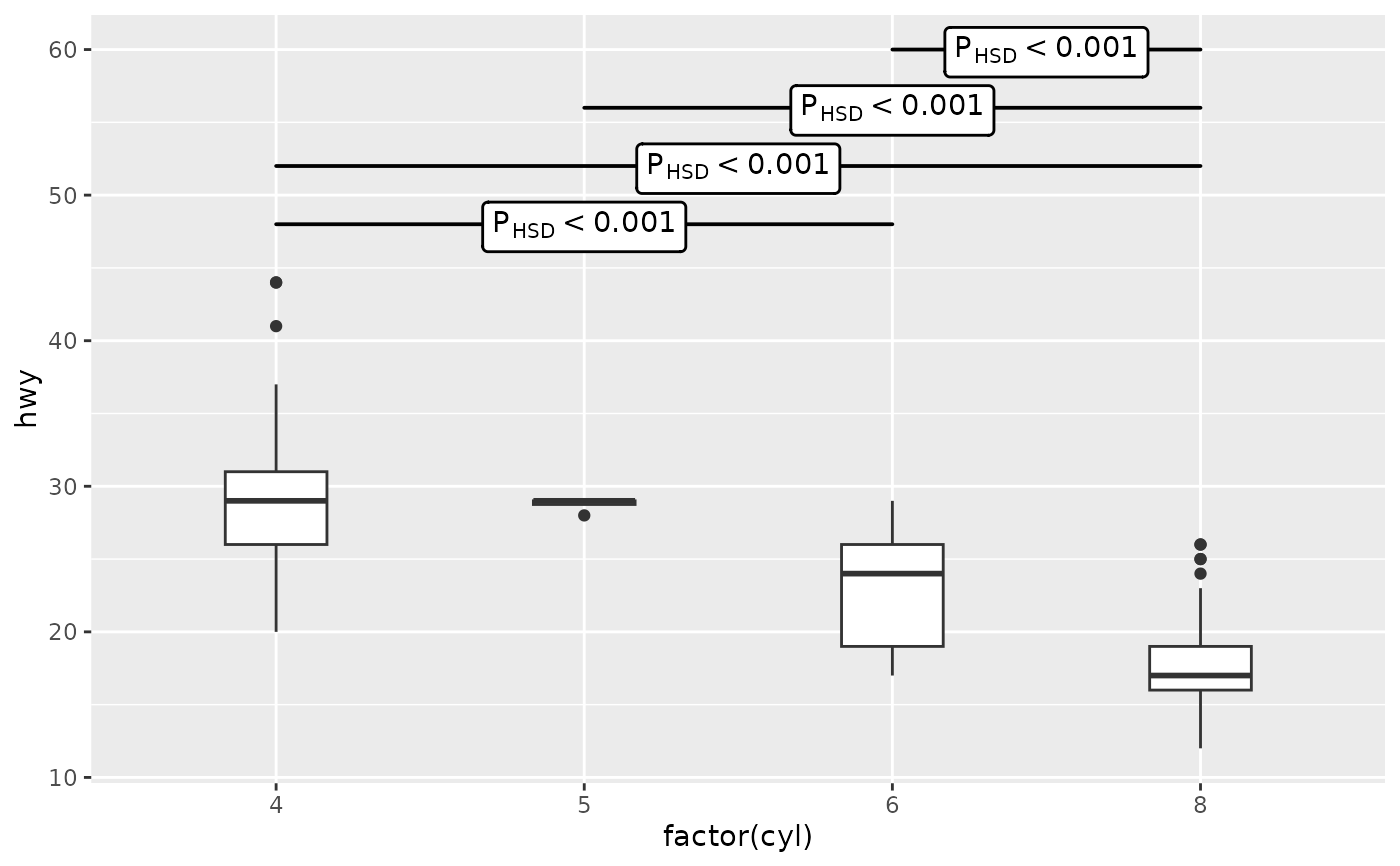
 # label only significant differences
# but test and correct for all pairwise contrasts!
p1 +
stat_multcomp(mc.cutoff.p.value = 0.01)
# label only significant differences
# but test and correct for all pairwise contrasts!
p1 +
stat_multcomp(mc.cutoff.p.value = 0.01)
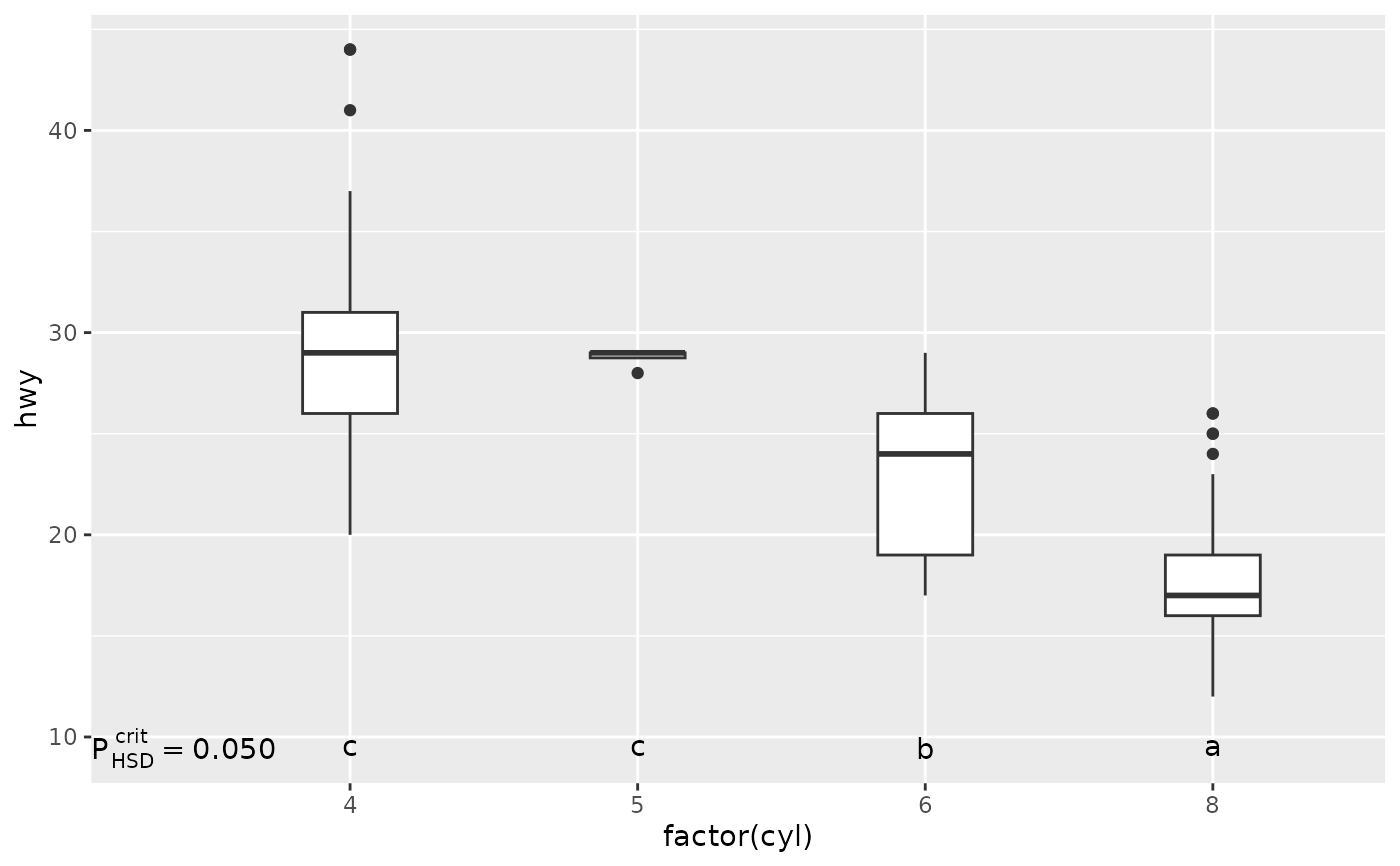
 ## letters as labels for test results
p1 +
stat_multcomp(label.type = "letters")
## letters as labels for test results
p1 +
stat_multcomp(label.type = "letters")
 # use capital letters
p1 +
stat_multcomp(label.type = "LETTERS")
# use capital letters
p1 +
stat_multcomp(label.type = "LETTERS")
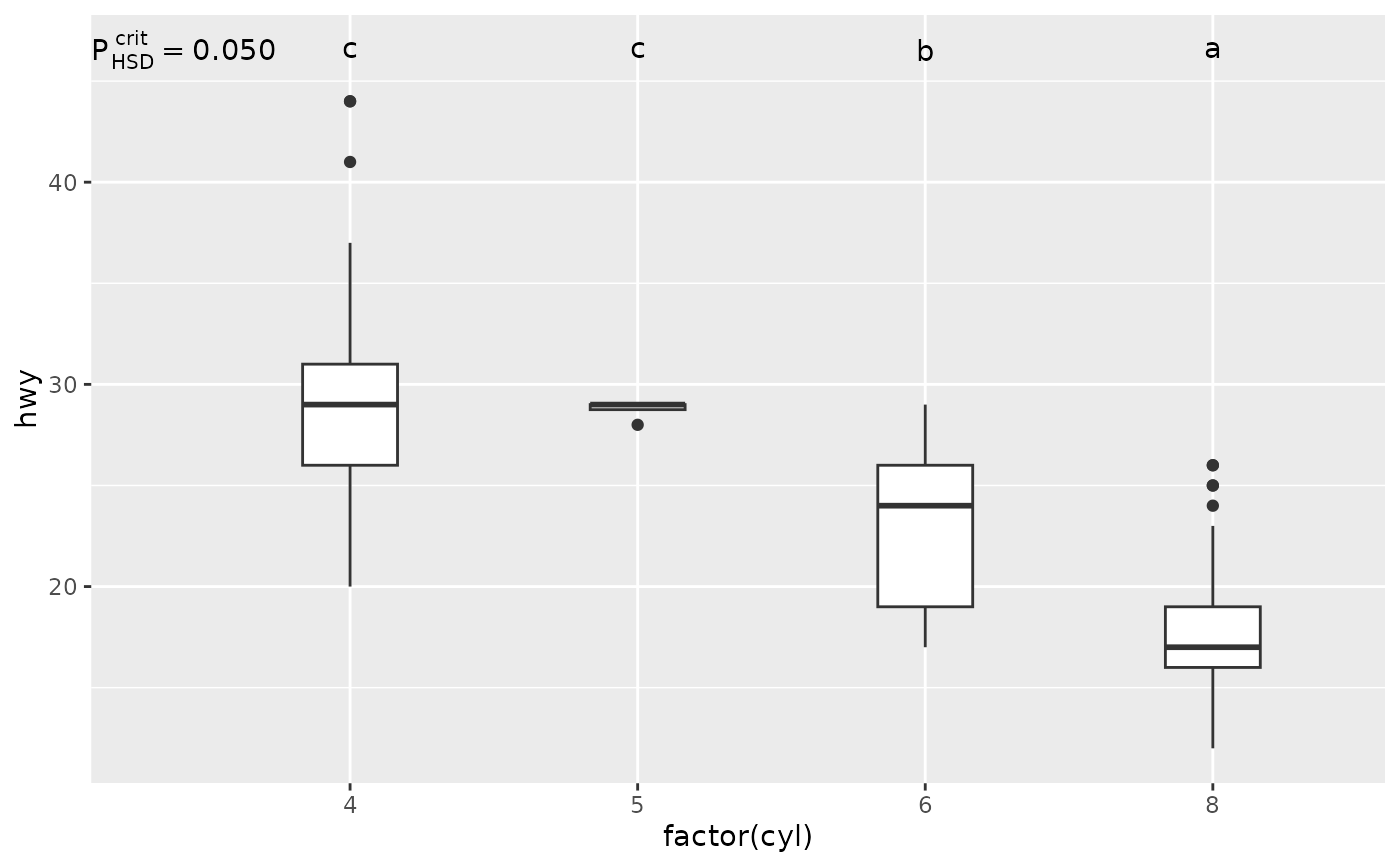
 # location
p1 +
stat_multcomp(label.type = "letters",
label.y = "top")
# location
p1 +
stat_multcomp(label.type = "letters",
label.y = "top")
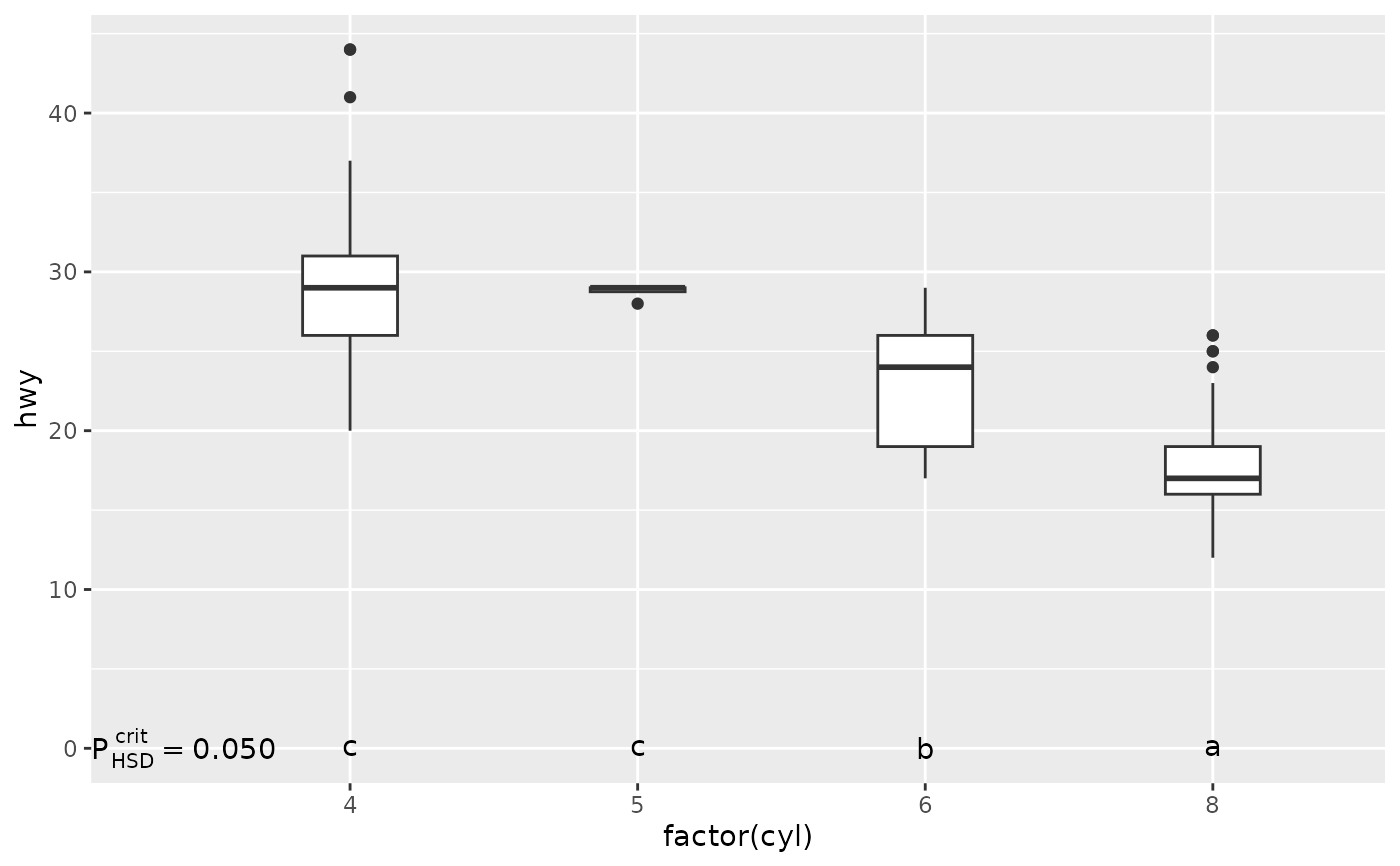
 p1 +
stat_multcomp(label.type = "letters",
label.y = 0)
p1 +
stat_multcomp(label.type = "letters",
label.y = 0)
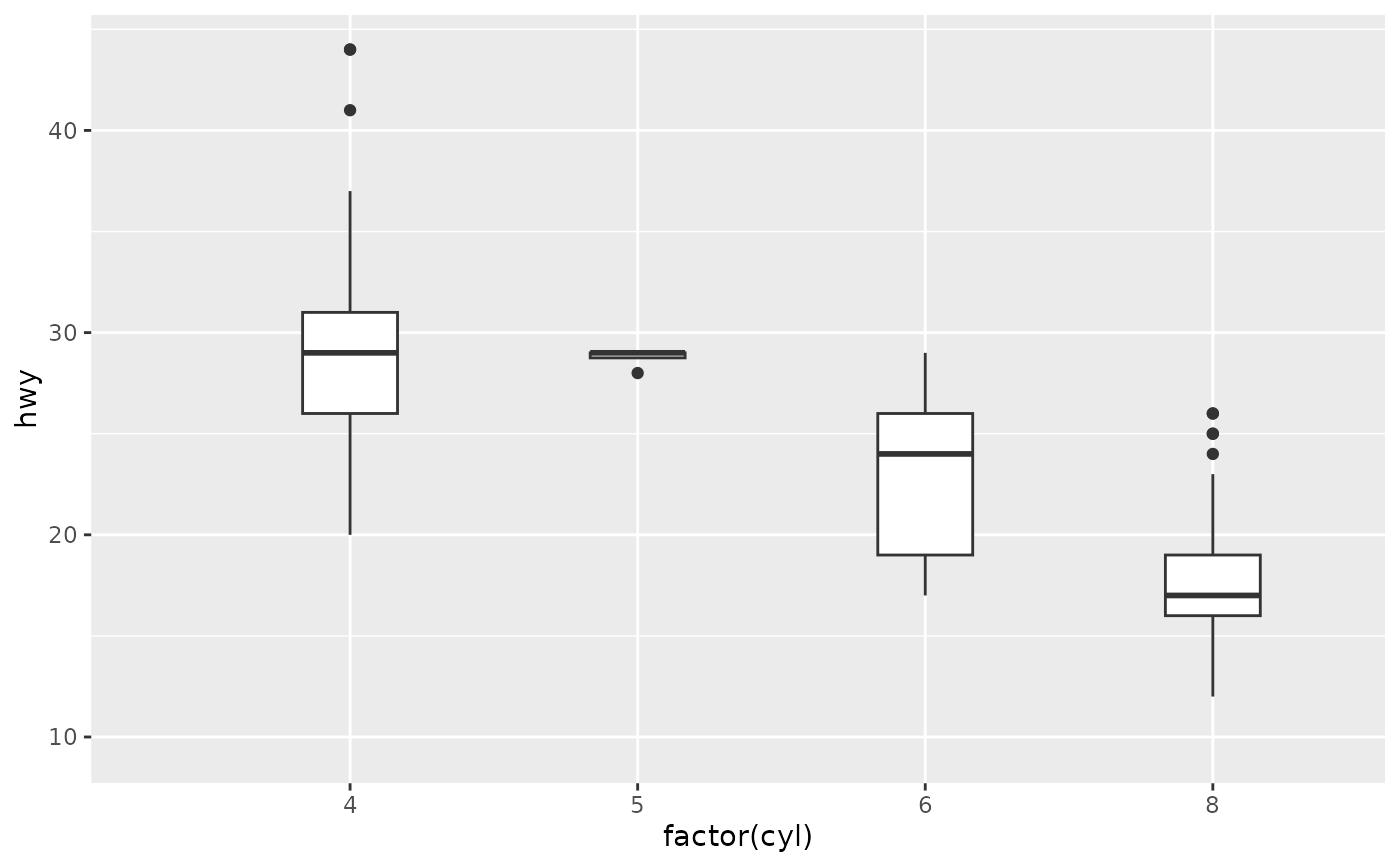
 # stricter critical p-value than default used for test
p1 +
stat_multcomp(label.type = "letters",
mc.critical.p.value = 0.01)
# stricter critical p-value than default used for test
p1 +
stat_multcomp(label.type = "letters",
mc.critical.p.value = 0.01)
 # Inspecting the returned data using geom_debug()
# This provides a quick way of finding out the names of the variables that
# are available for mapping to aesthetics with after_stat().
gginnards.installed <- requireNamespace("gginnards", quietly = TRUE)
if (gginnards.installed)
library(gginnards)
if (gginnards.installed)
p1 +
stat_multcomp(label.type = "bars",
geom = "debug")
# Inspecting the returned data using geom_debug()
# This provides a quick way of finding out the names of the variables that
# are available for mapping to aesthetics with after_stat().
gginnards.installed <- requireNamespace("gginnards", quietly = TRUE)
if (gginnards.installed)
library(gginnards)
if (gginnards.installed)
p1 +
stat_multcomp(label.type = "bars",
geom = "debug")
 #> [1] "PANEL 1; group(s) NULL; 'draw_function()' input 'data' (head):"
#> xmin xmax label hjust PANEL x y x.left.tip
#> 1 1 2 italic(P)[HSD]~`=`~"1.000" center 1 1.5 48 1
#> 2 1 3 italic(P)[HSD]~`<`~"0.001" center 1 2.0 52 1
#> 3 1 4 italic(P)[HSD]~`<`~"0.001" center 1 2.5 56 1
#> 4 2 3 italic(P)[HSD]~`=`~"0.013" center 1 2.5 60 2
#> 5 2 4 italic(P)[HSD]~`<`~"0.001" center 1 3.0 64 2
#> 6 3 4 italic(P)[HSD]~`<`~"0.001" center 1 3.5 68 3
#> x.right.tip coefficients contrasts tstat p.value fm.method
#> 1 2 -0.05246914 2-1 -0.02654434 9.999925e-01 lm:qr
#> 2 3 -5.97968433 3-1 -9.79894539 0.000000e+00 lm:qr
#> 3 4 -11.17389771 4-1 -17.74241622 0.000000e+00 lm:qr
#> 4 3 -5.92721519 3-2 -2.99681688 1.344679e-02 lm:qr
#> 5 4 -11.12142857 4-2 -5.60568576 2.058158e-07 lm:qr
#> 6 4 -5.19421338 4-3 -8.19962959 4.518608e-14 lm:qr
#> fm.class fm.formula fm.formula.chr mc.adjusted mc.contrast n just
#> 1 lm y ~ factor(x) y ~ factor(x) HSD 2-1 234 center
#> 2 lm y ~ factor(x) y ~ factor(x) HSD 3-1 234 center
#> 3 lm y ~ factor(x) y ~ factor(x) HSD 4-1 234 center
#> 4 lm y ~ factor(x) y ~ factor(x) HSD 3-2 234 center
#> 5 lm y ~ factor(x) y ~ factor(x) HSD 4-2 234 center
#> 6 lm y ~ factor(x) y ~ factor(x) HSD 4-3 234 center
#> stars.label p.value.label delta.label
#> 1 "n.s." italic(P)[HSD]~`=`~"1.000" italic(Delta)~`=`~"-0.0525"
#> 2 "***" italic(P)[HSD]~`<`~"0.001" italic(Delta)~`=`~"-5.98"
#> 3 "***" italic(P)[HSD]~`<`~"0.001" italic(Delta)~`=`~"-11.2"
#> 4 "*" italic(P)[HSD]~`=`~"0.013" italic(Delta)~`=`~"-5.93"
#> 5 "***" italic(P)[HSD]~`<`~"0.001" italic(Delta)~`=`~"-11.1"
#> 6 "***" italic(P)[HSD]~`<`~"0.001" italic(Delta)~`=`~"-5.19"
#> t.value.label default.label orientation
#> 1 italic(t)~`=`~"-0.0265" italic(P)[HSD]~`=`~"1.000" x
#> 2 italic(t)~`=`~"-9.80" italic(P)[HSD]~`<`~"0.001" x
#> 3 italic(t)~`=`~"-17.7" italic(P)[HSD]~`<`~"0.001" x
#> 4 italic(t)~`=`~"-3.00" italic(P)[HSD]~`=`~"0.013" x
#> 5 italic(t)~`=`~"-5.61" italic(P)[HSD]~`<`~"0.001" x
#> 6 italic(t)~`=`~"-8.20" italic(P)[HSD]~`<`~"0.001" x
if (gginnards.installed)
p1 +
stat_multcomp(label.type = "letters",
geom = "debug")
#> [1] "PANEL 1; group(s) NULL; 'draw_function()' input 'data' (head):"
#> xmin xmax label hjust PANEL x y x.left.tip
#> 1 1 2 italic(P)[HSD]~`=`~"1.000" center 1 1.5 48 1
#> 2 1 3 italic(P)[HSD]~`<`~"0.001" center 1 2.0 52 1
#> 3 1 4 italic(P)[HSD]~`<`~"0.001" center 1 2.5 56 1
#> 4 2 3 italic(P)[HSD]~`=`~"0.013" center 1 2.5 60 2
#> 5 2 4 italic(P)[HSD]~`<`~"0.001" center 1 3.0 64 2
#> 6 3 4 italic(P)[HSD]~`<`~"0.001" center 1 3.5 68 3
#> x.right.tip coefficients contrasts tstat p.value fm.method
#> 1 2 -0.05246914 2-1 -0.02654434 9.999925e-01 lm:qr
#> 2 3 -5.97968433 3-1 -9.79894539 0.000000e+00 lm:qr
#> 3 4 -11.17389771 4-1 -17.74241622 0.000000e+00 lm:qr
#> 4 3 -5.92721519 3-2 -2.99681688 1.344679e-02 lm:qr
#> 5 4 -11.12142857 4-2 -5.60568576 2.058158e-07 lm:qr
#> 6 4 -5.19421338 4-3 -8.19962959 4.518608e-14 lm:qr
#> fm.class fm.formula fm.formula.chr mc.adjusted mc.contrast n just
#> 1 lm y ~ factor(x) y ~ factor(x) HSD 2-1 234 center
#> 2 lm y ~ factor(x) y ~ factor(x) HSD 3-1 234 center
#> 3 lm y ~ factor(x) y ~ factor(x) HSD 4-1 234 center
#> 4 lm y ~ factor(x) y ~ factor(x) HSD 3-2 234 center
#> 5 lm y ~ factor(x) y ~ factor(x) HSD 4-2 234 center
#> 6 lm y ~ factor(x) y ~ factor(x) HSD 4-3 234 center
#> stars.label p.value.label delta.label
#> 1 "n.s." italic(P)[HSD]~`=`~"1.000" italic(Delta)~`=`~"-0.0525"
#> 2 "***" italic(P)[HSD]~`<`~"0.001" italic(Delta)~`=`~"-5.98"
#> 3 "***" italic(P)[HSD]~`<`~"0.001" italic(Delta)~`=`~"-11.2"
#> 4 "*" italic(P)[HSD]~`=`~"0.013" italic(Delta)~`=`~"-5.93"
#> 5 "***" italic(P)[HSD]~`<`~"0.001" italic(Delta)~`=`~"-11.1"
#> 6 "***" italic(P)[HSD]~`<`~"0.001" italic(Delta)~`=`~"-5.19"
#> t.value.label default.label orientation
#> 1 italic(t)~`=`~"-0.0265" italic(P)[HSD]~`=`~"1.000" x
#> 2 italic(t)~`=`~"-9.80" italic(P)[HSD]~`<`~"0.001" x
#> 3 italic(t)~`=`~"-17.7" italic(P)[HSD]~`<`~"0.001" x
#> 4 italic(t)~`=`~"-3.00" italic(P)[HSD]~`=`~"0.013" x
#> 5 italic(t)~`=`~"-5.61" italic(P)[HSD]~`<`~"0.001" x
#> 6 italic(t)~`=`~"-8.20" italic(P)[HSD]~`<`~"0.001" x
if (gginnards.installed)
p1 +
stat_multcomp(label.type = "letters",
geom = "debug")
 #> [1] "PANEL 1; group(s) NULL; 'draw_function()' input 'data' (head):"
#> xmin xmax label hjust PANEL x y x.left.tip
#> 1 NA NA italic(P)[HSD]^{crit}~`=`~"0.050" inward 1 0.1 9.44 NA
#> 2 NA NA c center 1 1.0 9.44 NA
#> 3 NA NA c center 1 2.0 9.44 NA
#> 4 NA NA b center 1 3.0 9.44 NA
#> 5 NA NA a center 1 4.0 9.44 NA
#> x.right.tip critical.p.value fm.method fm.class fm.formula fm.formula.chr
#> 1 NA 0.05 lm:qr lm y ~ factor(x) y ~ factor(x)
#> 2 NA 0.05 lm:qr lm y ~ factor(x) y ~ factor(x)
#> 3 NA 0.05 lm:qr lm y ~ factor(x) y ~ factor(x)
#> 4 NA 0.05 lm:qr lm y ~ factor(x) y ~ factor(x)
#> 5 NA 0.05 lm:qr lm y ~ factor(x) y ~ factor(x)
#> mc.adjusted mc.contrast n letters.label just
#> 1 HSD Tukey 234 italic(P)[HSD]^{crit}~`=`~"0.050" inward
#> 2 HSD Tukey 234 c center
#> 3 HSD Tukey 234 c center
#> 4 HSD Tukey 234 b center
#> 5 HSD Tukey 234 a center
#> default.label orientation
#> 1 italic(P)[HSD]^{crit}~`=`~"0.050" x
#> 2 c x
#> 3 c x
#> 4 b x
#> 5 a x
if (gginnards.installed)
p1 +
stat_multcomp(label.type = "bars",
output.type = "numeric",
geom = "debug")
#> [1] "PANEL 1; group(s) NULL; 'draw_function()' input 'data' (head):"
#> xmin xmax label hjust PANEL x y x.left.tip
#> 1 NA NA italic(P)[HSD]^{crit}~`=`~"0.050" inward 1 0.1 9.44 NA
#> 2 NA NA c center 1 1.0 9.44 NA
#> 3 NA NA c center 1 2.0 9.44 NA
#> 4 NA NA b center 1 3.0 9.44 NA
#> 5 NA NA a center 1 4.0 9.44 NA
#> x.right.tip critical.p.value fm.method fm.class fm.formula fm.formula.chr
#> 1 NA 0.05 lm:qr lm y ~ factor(x) y ~ factor(x)
#> 2 NA 0.05 lm:qr lm y ~ factor(x) y ~ factor(x)
#> 3 NA 0.05 lm:qr lm y ~ factor(x) y ~ factor(x)
#> 4 NA 0.05 lm:qr lm y ~ factor(x) y ~ factor(x)
#> 5 NA 0.05 lm:qr lm y ~ factor(x) y ~ factor(x)
#> mc.adjusted mc.contrast n letters.label just
#> 1 HSD Tukey 234 italic(P)[HSD]^{crit}~`=`~"0.050" inward
#> 2 HSD Tukey 234 c center
#> 3 HSD Tukey 234 c center
#> 4 HSD Tukey 234 b center
#> 5 HSD Tukey 234 a center
#> default.label orientation
#> 1 italic(P)[HSD]^{crit}~`=`~"0.050" x
#> 2 c x
#> 3 c x
#> 4 b x
#> 5 a x
if (gginnards.installed)
p1 +
stat_multcomp(label.type = "bars",
output.type = "numeric",
geom = "debug")
 #> [1] "PANEL 1; group(s) NULL; 'draw_function()' input 'data' (head):"
#> xmin xmax label hjust PANEL x y x.left.tip x.right.tip coefficients
#> 1 1 2 <NA> center 1 1.5 48 1 2 -0.05246914
#> 2 1 3 <NA> center 1 2.0 52 1 3 -5.97968433
#> 3 1 4 <NA> center 1 2.5 56 1 4 -11.17389771
#> 4 2 3 <NA> center 1 2.5 60 2 3 -5.92721519
#> 5 2 4 <NA> center 1 3.0 64 2 4 -11.12142857
#> 6 3 4 <NA> center 1 3.5 68 3 4 -5.19421338
#> contrasts tstat p.value fm.method fm.class fm.formula
#> 1 2-1 -0.02654434 9.999925e-01 lm:qr lm y ~ factor(x)
#> 2 3-1 -9.79894539 0.000000e+00 lm:qr lm y ~ factor(x)
#> 3 4-1 -17.74241622 0.000000e+00 lm:qr lm y ~ factor(x)
#> 4 3-2 -2.99681688 1.343549e-02 lm:qr lm y ~ factor(x)
#> 5 4-2 -5.60568576 2.052055e-07 lm:qr lm y ~ factor(x)
#> 6 4-3 -8.19962959 3.308465e-14 lm:qr lm y ~ factor(x)
#> fm.formula.chr mc.adjusted mc.contrast n just default.label orientation
#> 1 y ~ factor(x) HSD 2-1 234 center <NA> x
#> 2 y ~ factor(x) HSD 3-1 234 center <NA> x
#> 3 y ~ factor(x) HSD 4-1 234 center <NA> x
#> 4 y ~ factor(x) HSD 3-2 234 center <NA> x
#> 5 y ~ factor(x) HSD 4-2 234 center <NA> x
#> 6 y ~ factor(x) HSD 4-3 234 center <NA> x
#> [1] "PANEL 1; group(s) NULL; 'draw_function()' input 'data' (head):"
#> xmin xmax label hjust PANEL x y x.left.tip x.right.tip coefficients
#> 1 1 2 <NA> center 1 1.5 48 1 2 -0.05246914
#> 2 1 3 <NA> center 1 2.0 52 1 3 -5.97968433
#> 3 1 4 <NA> center 1 2.5 56 1 4 -11.17389771
#> 4 2 3 <NA> center 1 2.5 60 2 3 -5.92721519
#> 5 2 4 <NA> center 1 3.0 64 2 4 -11.12142857
#> 6 3 4 <NA> center 1 3.5 68 3 4 -5.19421338
#> contrasts tstat p.value fm.method fm.class fm.formula
#> 1 2-1 -0.02654434 9.999925e-01 lm:qr lm y ~ factor(x)
#> 2 3-1 -9.79894539 0.000000e+00 lm:qr lm y ~ factor(x)
#> 3 4-1 -17.74241622 0.000000e+00 lm:qr lm y ~ factor(x)
#> 4 3-2 -2.99681688 1.343549e-02 lm:qr lm y ~ factor(x)
#> 5 4-2 -5.60568576 2.052055e-07 lm:qr lm y ~ factor(x)
#> 6 4-3 -8.19962959 3.308465e-14 lm:qr lm y ~ factor(x)
#> fm.formula.chr mc.adjusted mc.contrast n just default.label orientation
#> 1 y ~ factor(x) HSD 2-1 234 center <NA> x
#> 2 y ~ factor(x) HSD 3-1 234 center <NA> x
#> 3 y ~ factor(x) HSD 4-1 234 center <NA> x
#> 4 y ~ factor(x) HSD 3-2 234 center <NA> x
#> 5 y ~ factor(x) HSD 4-2 234 center <NA> x
#> 6 y ~ factor(x) HSD 4-3 234 center <NA> x