Plot SVM Objects
plot.svm.RdGenerates a scatter plot of the input data of a svm fit for
classification models by highlighting the classes and support
vectors. Optionally, draws a filled contour plot of the class regions.
Arguments
- x
An object of class
svm- data
data to visualize. Should be the same used for fitting.
- formula
formula selecting the visualized two dimensions. Only needed if more than two input variables are used.
- fill
switch indicating whether a contour plot for the class regions should be added.
- grid
granularity for the contour plot.
- slice
a list of named values for the dimensions held constant (only needed if more than two variables are used). The defaults for unspecified dimensions are 0 (for numeric variables) and the first level (for factors). Factor levels can either be specified as factors or character vectors of length 1.
- symbolPalette
Color palette used for the class the data points and support vectors belong to.
- svSymbol
Symbol used for support vectors.
- dataSymbol
Symbol used for data points (other than support vectors).
- ...
additional graphics parameters passed to
filled.contourandplot.
Author
David Meyer
David.Meyer@R-project.org
Examples
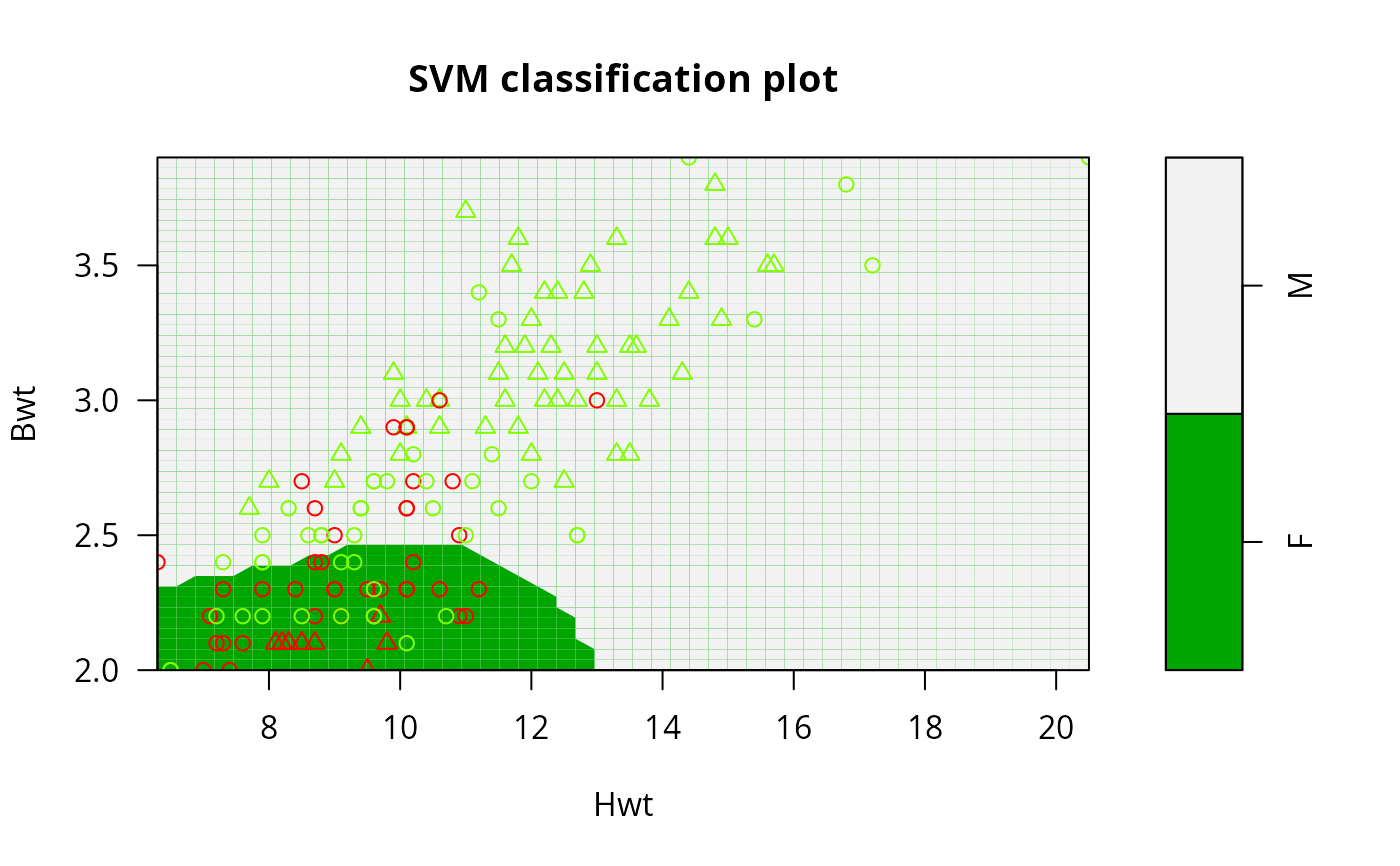
## a simple example
data(cats, package = "MASS")
m <- svm(Sex~., data = cats)
plot(m, cats)
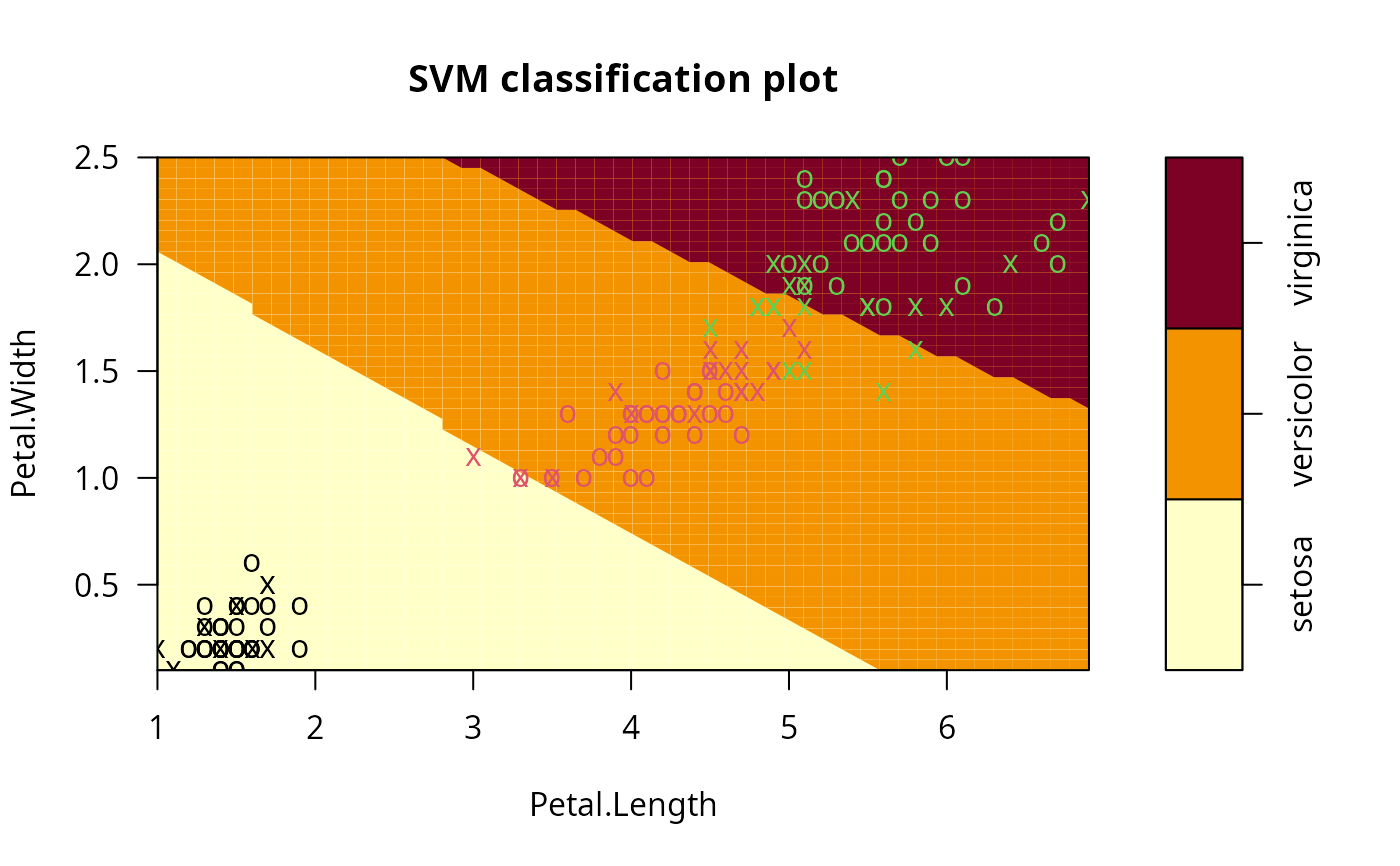
 ## more than two variables: fix 2 dimensions
data(iris)
m2 <- svm(Species~., data = iris)
plot(m2, iris, Petal.Width ~ Petal.Length,
slice = list(Sepal.Width = 3, Sepal.Length = 4))
## more than two variables: fix 2 dimensions
data(iris)
m2 <- svm(Species~., data = iris)
plot(m2, iris, Petal.Width ~ Petal.Length,
slice = list(Sepal.Width = 3, Sepal.Length = 4))
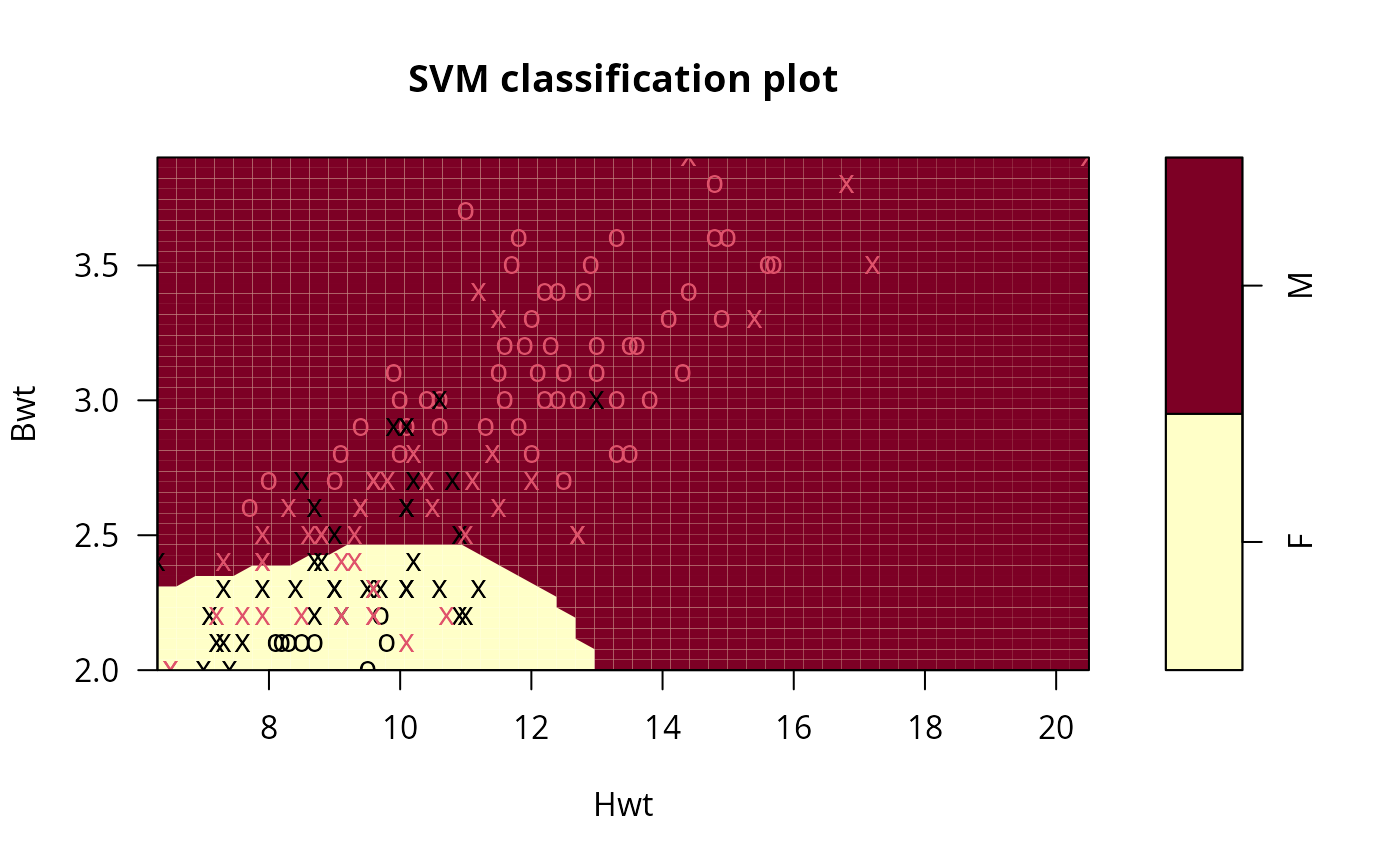
 ## plot with custom symbols and colors
plot(m, cats, svSymbol = 1, dataSymbol = 2, symbolPalette = rainbow(4),
color.palette = terrain.colors)
## plot with custom symbols and colors
plot(m, cats, svSymbol = 1, dataSymbol = 2, symbolPalette = rainbow(4),
color.palette = terrain.colors)