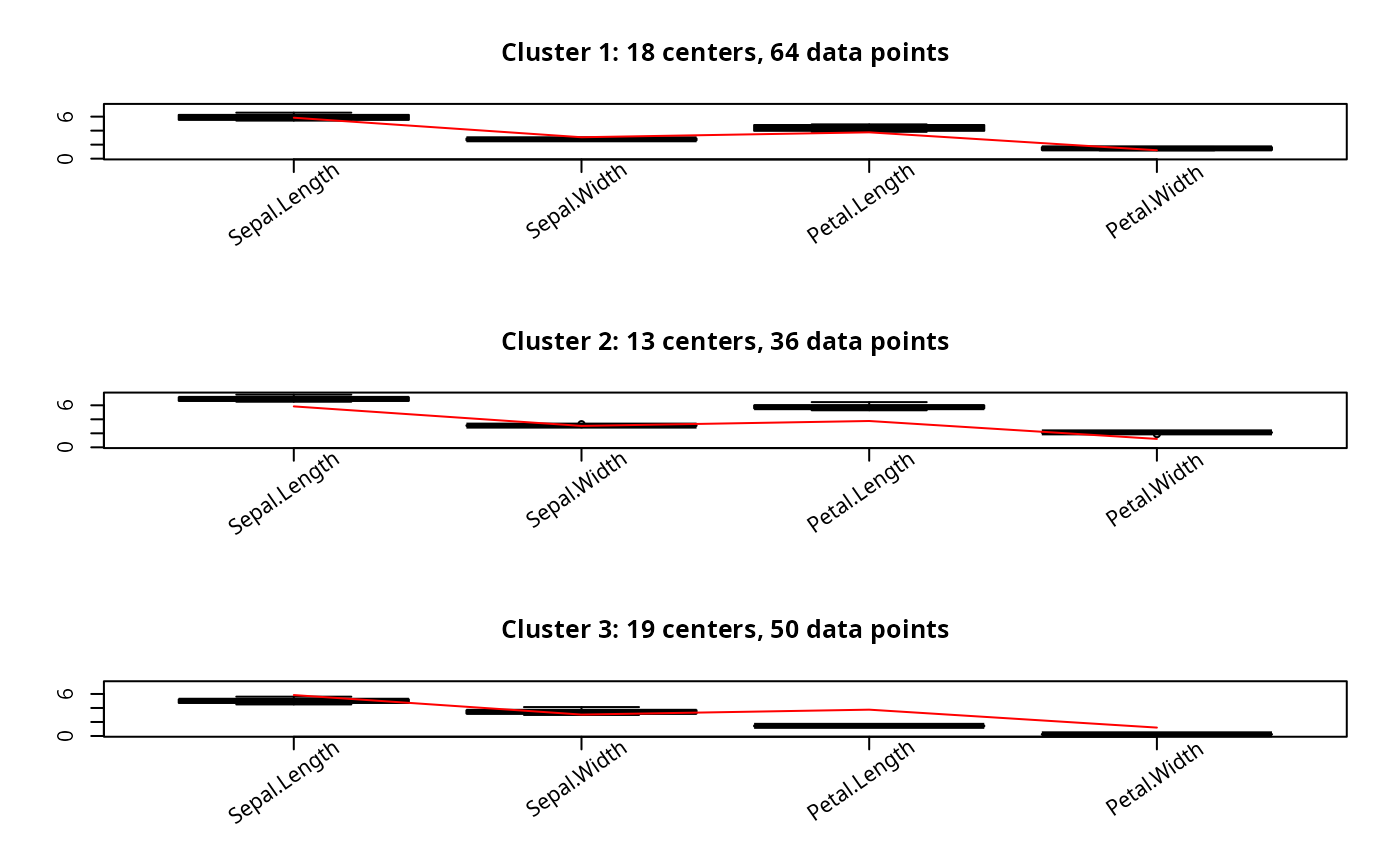
Boxplot of Cluster Profiles
boxplot.bclust.RdMakes boxplots of the results of a bagged clustering run.
Usage
# S3 method for class 'bclust'
boxplot(x, n=nrow(x$centers), bycluster=TRUE,
        main=deparse(substitute(x)), oneplot=TRUE,
        which=1:n, ...)
Arguments
- n
Number of clusters to plot, by default the number of clusters used in the call of
bclust.- bycluster
If
TRUE(default), a boxplot for each cluster is plotted. IfFALSE, a boxplot for each variable is plotted.- main
Main title of the plot, by default the name of the cluster object.
- oneplot
If
TRUE, all boxplots appear on one screen (using an appropriate rectangular layout).- which
Number of clusters which should be plotted, default is all clusters.
- ...
Additional arguments for
boxplot.