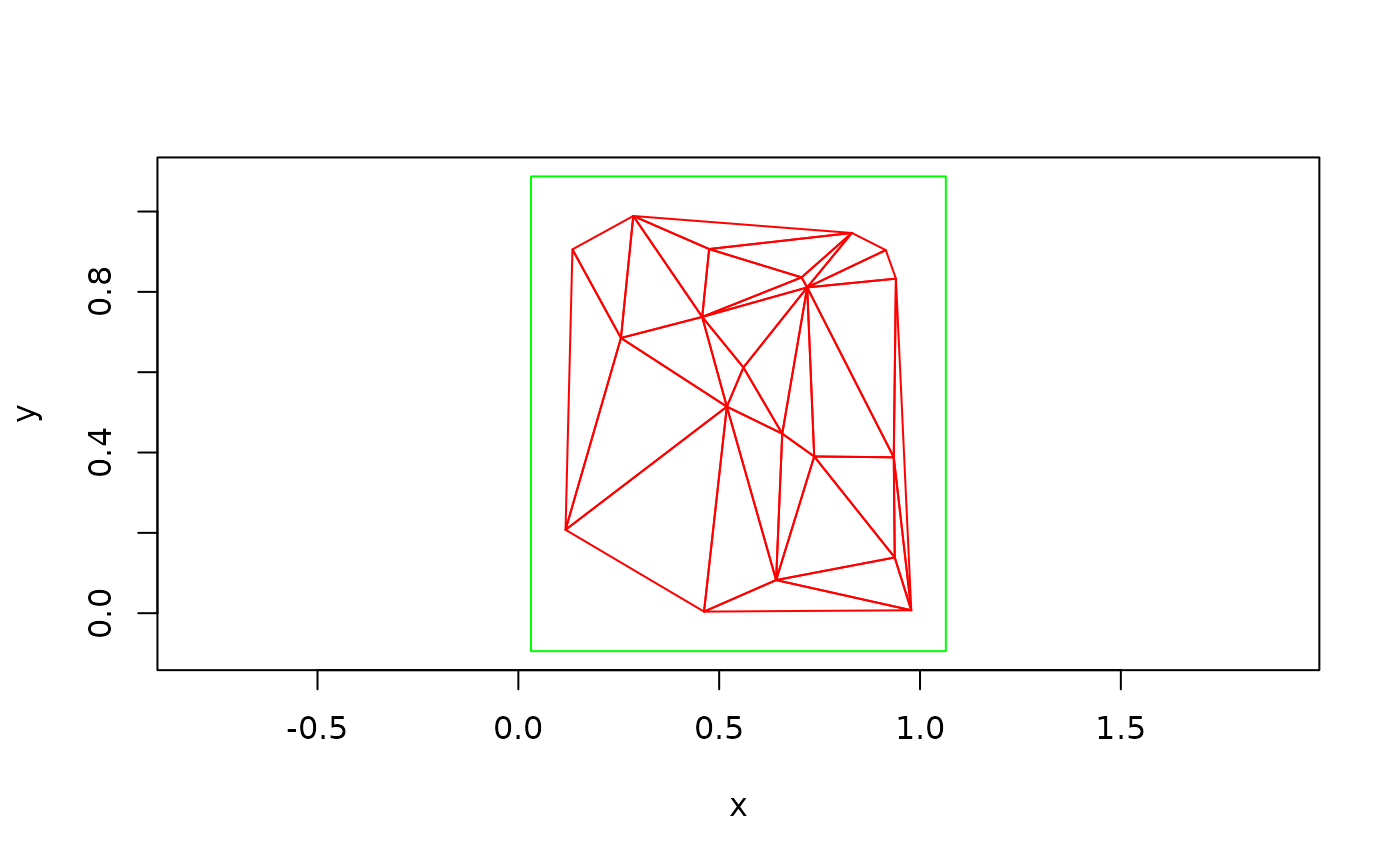
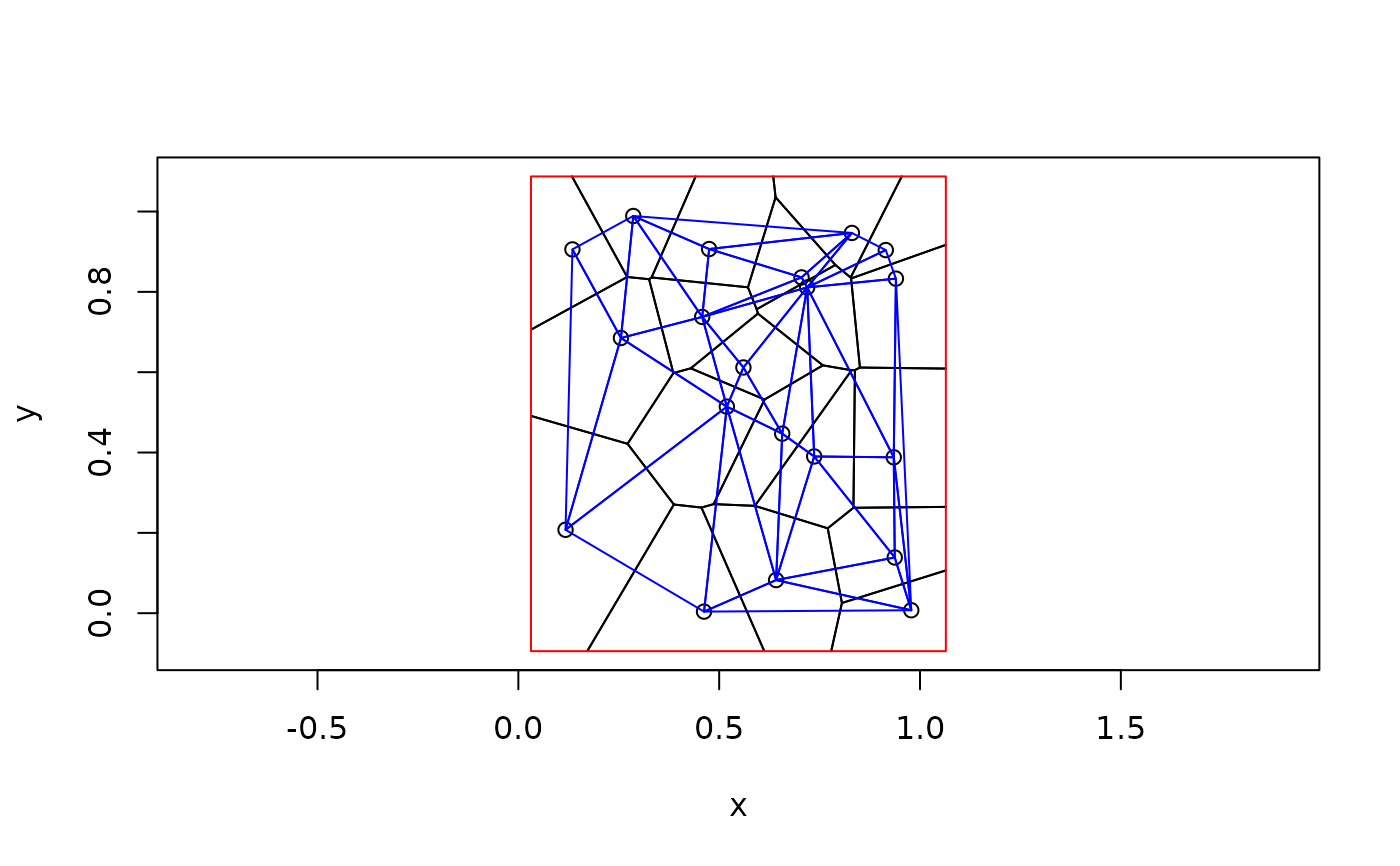
Plot Delaunay triangles
plot.triang.list.RdA method for plot. Plots the triangles of
a Delaunay triangulation of a set of points in the plane.
# S3 method for class 'triang.list'
plot(x, showrect = FALSE, add = FALSE,
              xlab = "x", ylab = "y", main = "", asp = 1,
              rectcol="black", ...)
Arguments
- x
An object of class “triang.list” as produced by
triang.list().- showrect
Logical scalar; show the enclosing rectangle
rw(seedeldir()) be plotted?- add
Logical scalar; should the plot of the triangles be added to an existing plot?
- xlab
Label for the
x-axis.- ylab
Label for the
y-axis.- main
A title for the plot (used only if
addisFALSE).- asp
The aspect ratio of the plot; integer scalar or
NA. Set this argument equal toNAto allow the data to determine the aspect ratio and hence to make the plot occupy the complete plotting region in bothxandydirections. This is inadvisable; see the Warnings.- rectcol
Text string or integer specifying the colour in which the enclosing rectangle should be plotted. Ignored unless
showrectisTRUE.- ...
Arguments passed to
polygon()which does the actual plotting of the triangles.
Warnings
Users are strongly advised not to set the value of
asp (unless they really know what they are doing) but rather
to leave asp equal to its default value of 1.
Any other value distorts the tesselation and destroys the
perpendicular appearance of lines which are indeed perpendicular.
(And conversely can cause lines which are not perpendicular to
appear as if they are.)
The argument asp was added at the request of Zubin
Dowlaty (who presumably knows what he is doing!).
Value
None. This function has the side effect of producing (or adding to) a plot.
See also
deldir(), plot.triang.list(),
tile.list(), plot.tile.list()