Boxplots With Point Identification
Boxplot.RdBoxplot is a wrapper for the standard R boxplot function, providing point identification,
axis labels, and a formula interface for boxplots without a grouping variable.
Usage
Boxplot(y, ...)

# Default S3 method
Boxplot(y, g, id=TRUE, xlab, ylab, ...)

# S3 method for class 'formula'
Boxplot(formula, data=NULL, subset, na.action=NULL,
    id=TRUE, xlab, ylab, ...)

# S3 method for class 'list'
Boxplot(y, xlab="", ylab="", ...)

# S3 method for class 'data.frame'
Boxplot(y, id=TRUE, ...)

# S3 method for class 'matrix'
Boxplot(y, ...)
Arguments
- y
a numeric variable for which the boxplot is to be constructed; a list of numeric variables, each element of which will be treated as a group; a numeric data frame or a numeric matrix, each of whose columns will be treated as a group.
- g
a grouping variable, usually a factor, for constructing parallel boxplots.
- id
a list of named elements giving one or more specifications for labels of individual points ("outliers"):
n, the maximum number of points to label (default 10);location,"lr"(left or right) of points or"avoid"to try to avoid overplotting;method, one of"y"(automatic, the default),"identify"(interactive), or"none";colfor labels (default is the first color incarPalette()); andcexsize of labels (default is1). Can beFALSEto suppress point identification orTRUE(the default) to use all defaults. This is similar to howshowLabelshandles point labels for other functions in the car package, except that the usual default isid=FALSE.- xlab, ylab
text labels for the horizontal and vertical axes; if missing,
Boxplotwill use the variable names, or, in the case of a list, data frame, or matrix, empty labels.- formula
a `model' formula, of the form
~ yto produce a boxplot for the variabley, or of the formy ~ g,y ~ g1*g2*..., ory ~ g1 + g2 + ...to produce parallel boxplots forywithin levels of the grouping variable(s)g, etc., usually factors.- data, subset, na.action
as for statistical modeling functions (see, e.g.,
lm).- ...
further arguments, such as
at, to be passed toboxplot.
Author
John Fox jfox@mcmaster.ca, with a contribution from Steve Ellison
to handle at argument (see boxplot).
References
Fox, J. and Weisberg, S. (2019) An R Companion to Applied Regression, Third Edition, Sage.
Examples
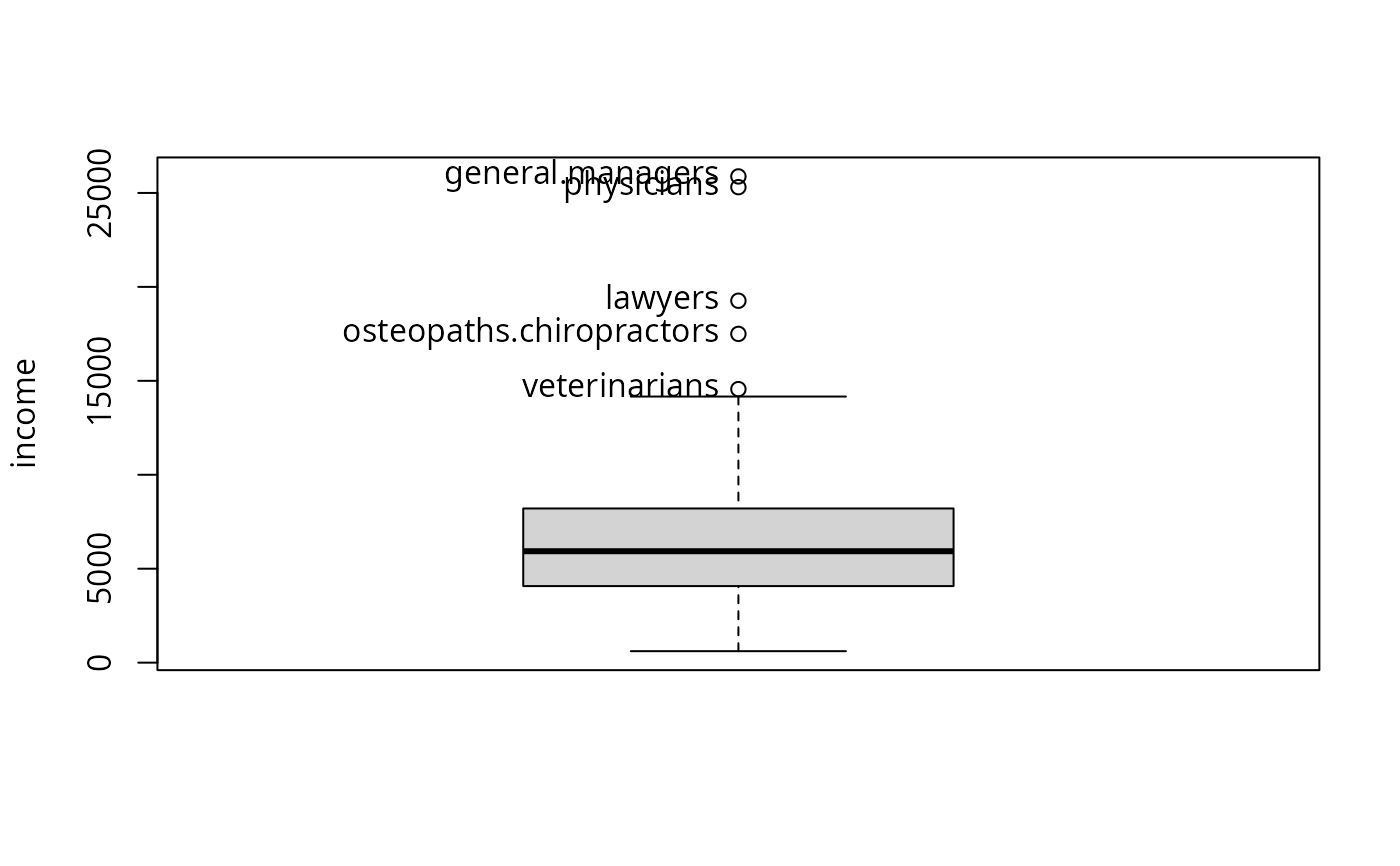
Boxplot(~income, data=Prestige, id=list(n=Inf)) # identify all outliers
 #> [1] "general.managers" "lawyers"
#> [3] "physicians" "veterinarians"
#> [5] "osteopaths.chiropractors"
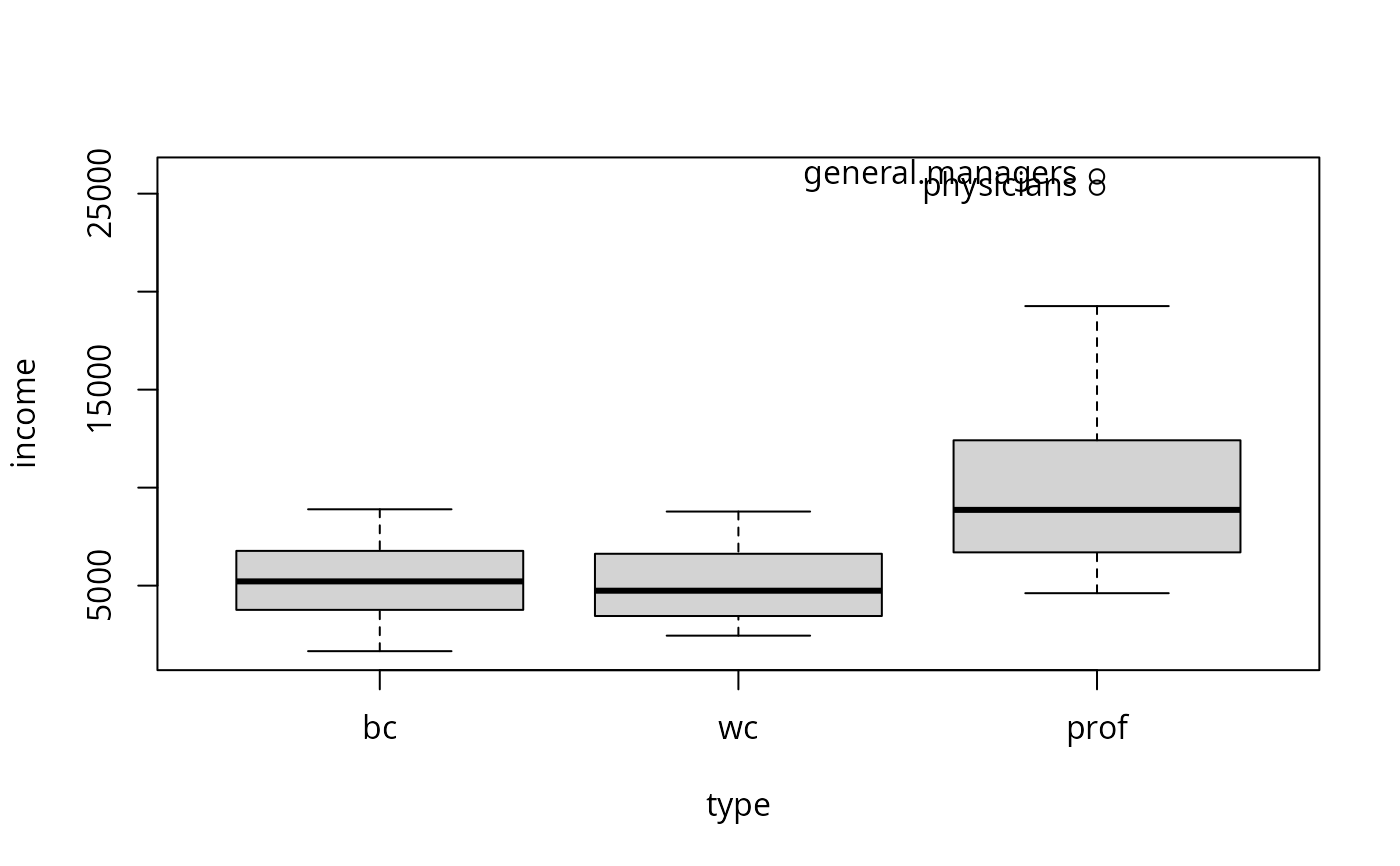
Boxplot(income ~ type, data=Prestige)
#> [1] "general.managers" "lawyers"
#> [3] "physicians" "veterinarians"
#> [5] "osteopaths.chiropractors"
Boxplot(income ~ type, data=Prestige)
 #> [1] "general.managers" "physicians"
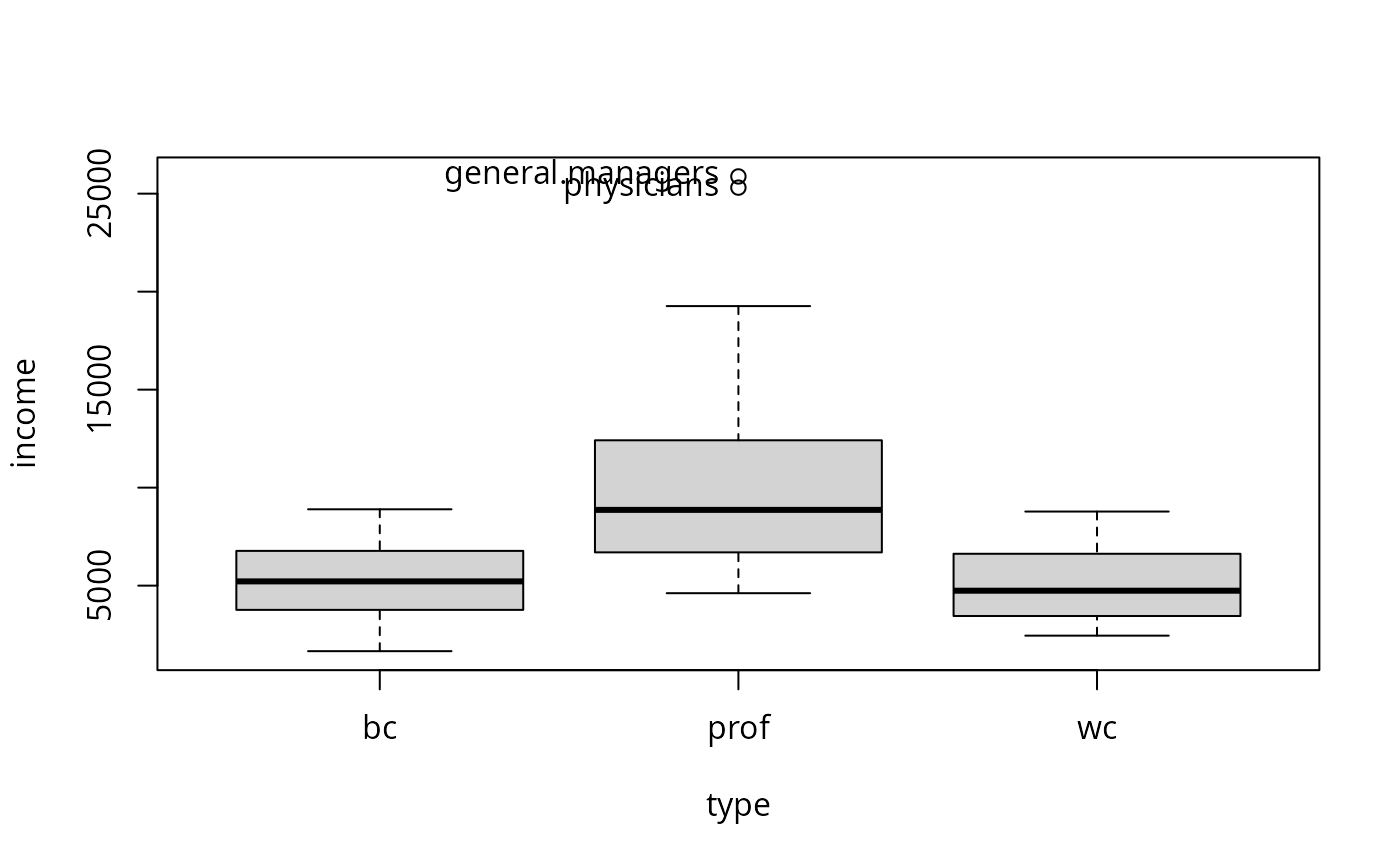
Boxplot(income ~ type, data=Prestige, at=c(1, 3, 2))
#> [1] "general.managers" "physicians"
Boxplot(income ~ type, data=Prestige, at=c(1, 3, 2))
 #> [1] "general.managers" "physicians"
Boxplot(k5 + k618 ~ lfp*wc, data=Mroz)
#> [1] "general.managers" "physicians"
Boxplot(k5 + k618 ~ lfp*wc, data=Mroz)
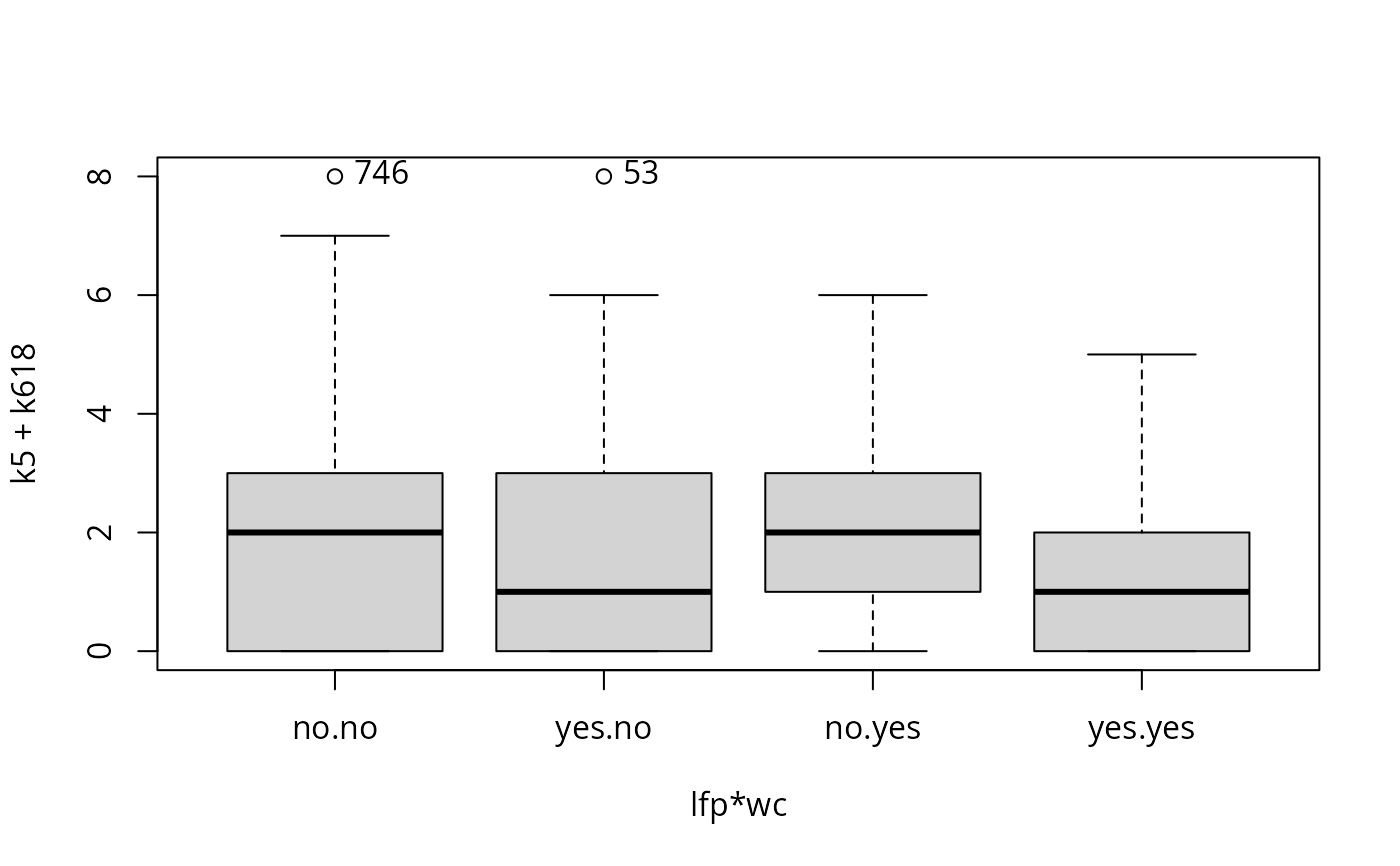 #> [1] "746" "53"
with(Prestige, Boxplot(income, id=list(labels=rownames(Prestige))))
#> [1] "746" "53"
with(Prestige, Boxplot(income, id=list(labels=rownames(Prestige))))
 #> [1] "general.managers" "lawyers"
#> [3] "physicians" "veterinarians"
#> [5] "osteopaths.chiropractors"
with(Prestige, Boxplot(income, type, id=list(labels=rownames(Prestige))))
#> [1] "general.managers" "lawyers"
#> [3] "physicians" "veterinarians"
#> [5] "osteopaths.chiropractors"
with(Prestige, Boxplot(income, type, id=list(labels=rownames(Prestige))))
 #> [1] "general.managers" "physicians"
Boxplot(scale(Prestige[, 1:4]))
#> [1] "general.managers" "physicians"
Boxplot(scale(Prestige[, 1:4]))
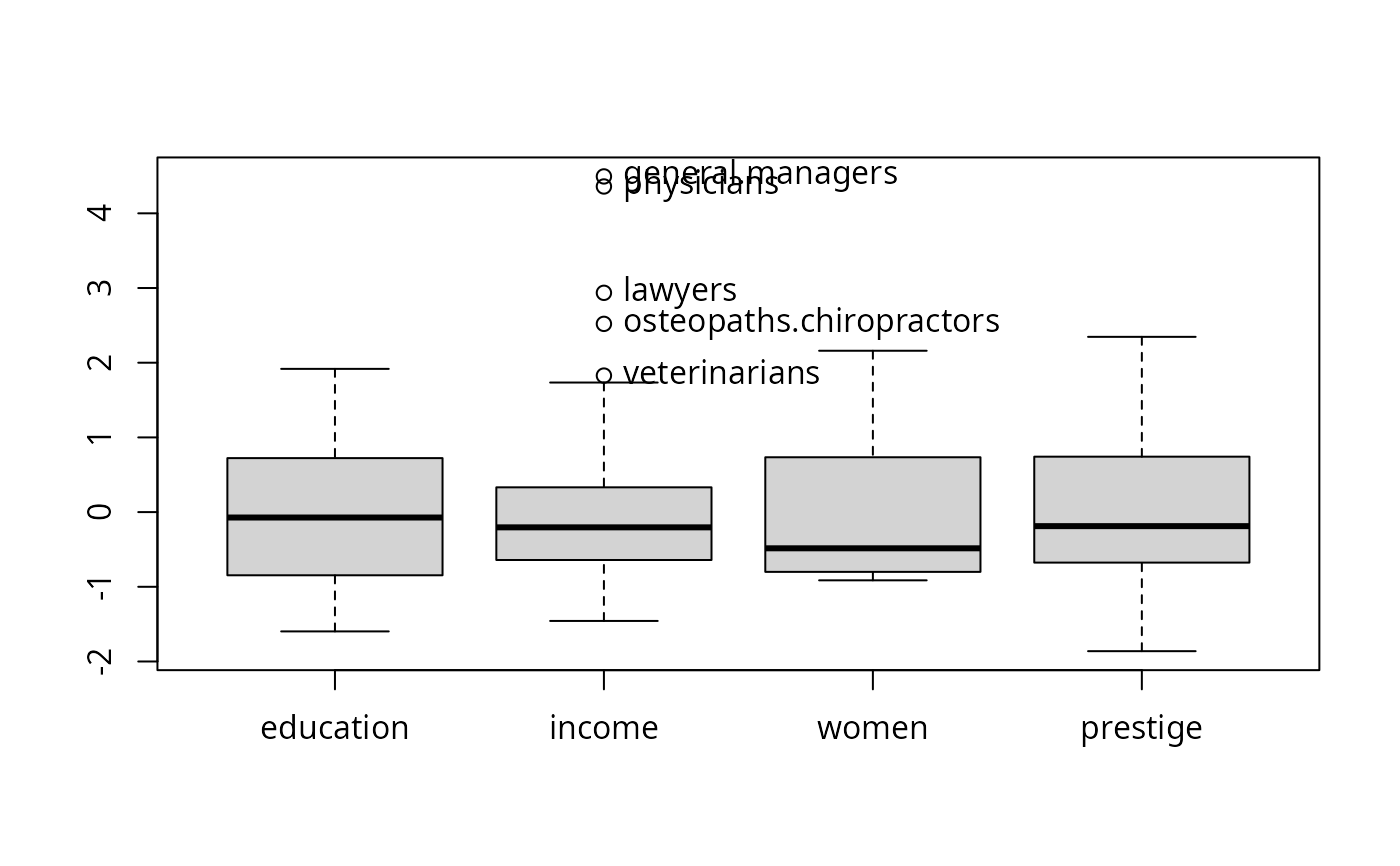 #> [1] "general.managers" "lawyers"
#> [3] "physicians" "veterinarians"
#> [5] "osteopaths.chiropractors"
#> [1] "general.managers" "lawyers"
#> [3] "physicians" "veterinarians"
#> [5] "osteopaths.chiropractors"