Derivatives of the Incomplete Gamma Integral
pgamma.deriv.RdThe first two derivatives of the incomplete gamma integral.
Details
Write \(x = q\) and shape = \(a\).
The first and second derivatives with respect to \(q\) and \(a\)
are returned. This function is similar in spirit to
pgamma;
define
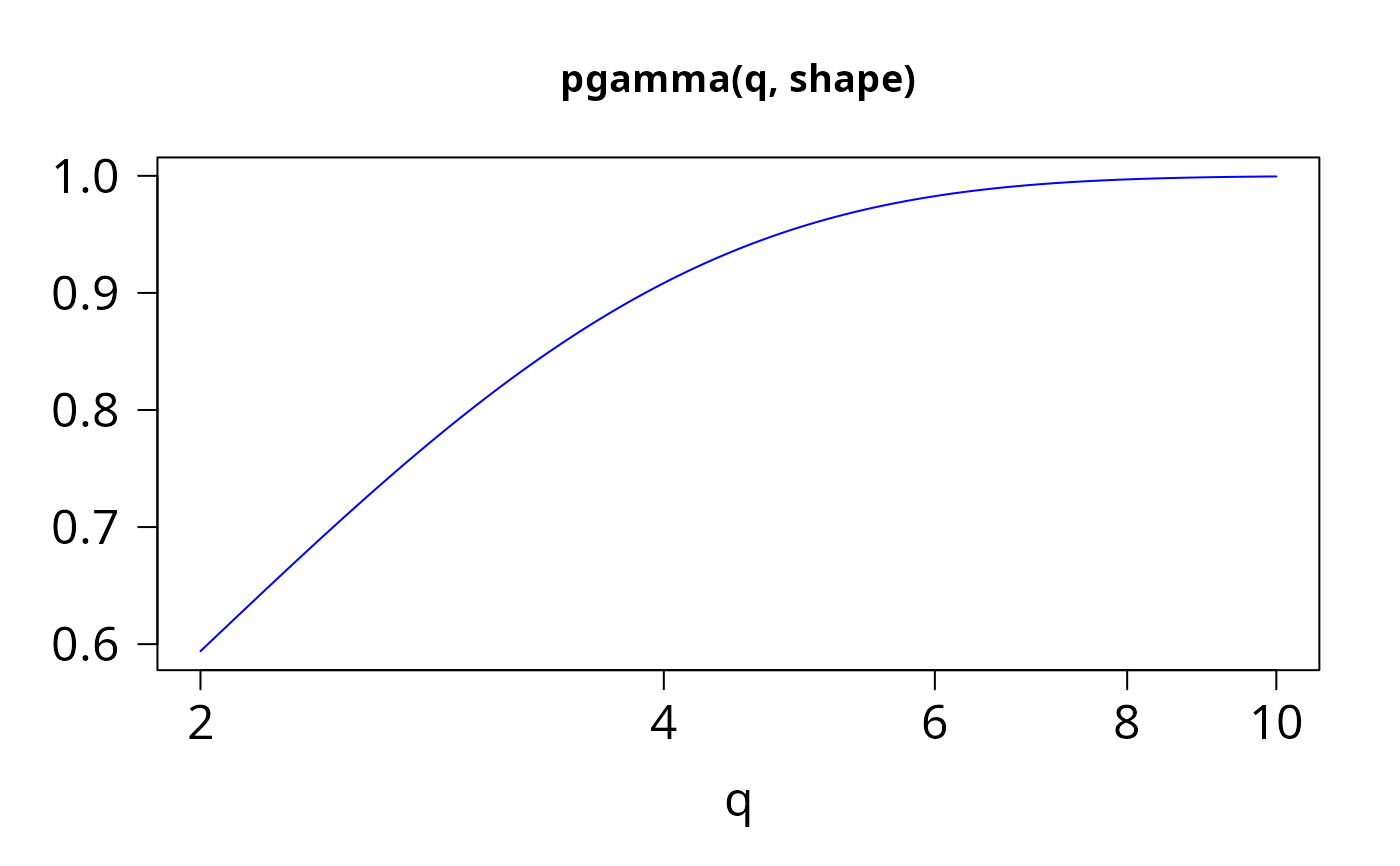
$$P(a,x) = \frac{1}{\Gamma(a)} \int_0^x t^{a-1} e^{-t} dt$$
so that
\(P(a, x)\) is pgamma(x, a).
Currently a 6-column matrix is returned (in the future this
may change and an argument may be supplied so that only what
is required by the user is computed.)
The computations use a series expansion for \(a \leq x \leq 1\) or or \(x < a\), else otherwise a continued fraction expansion. Machine overflow can occur for large values of \(x\) when \(x\) is much greater than \(a\).
Value
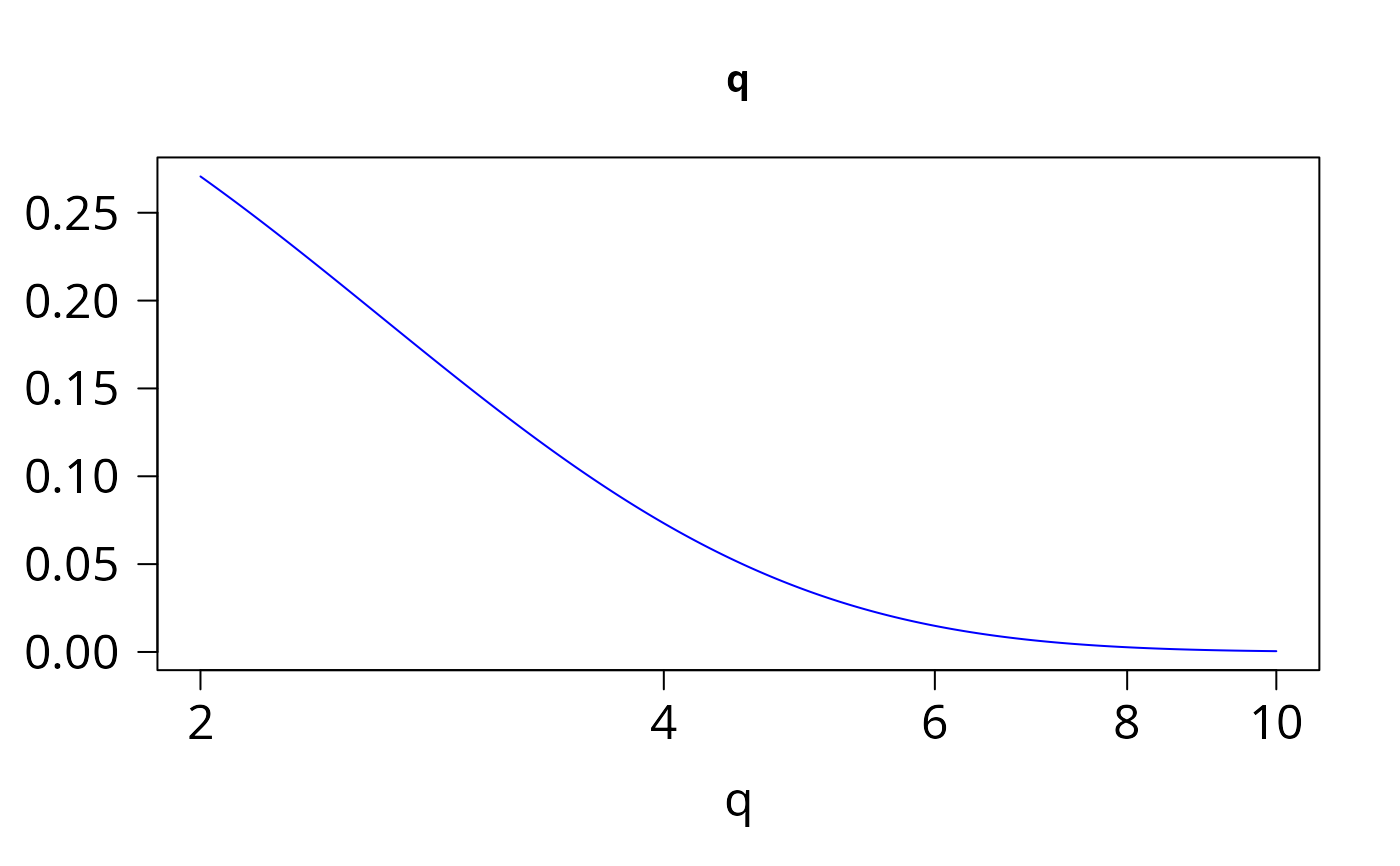
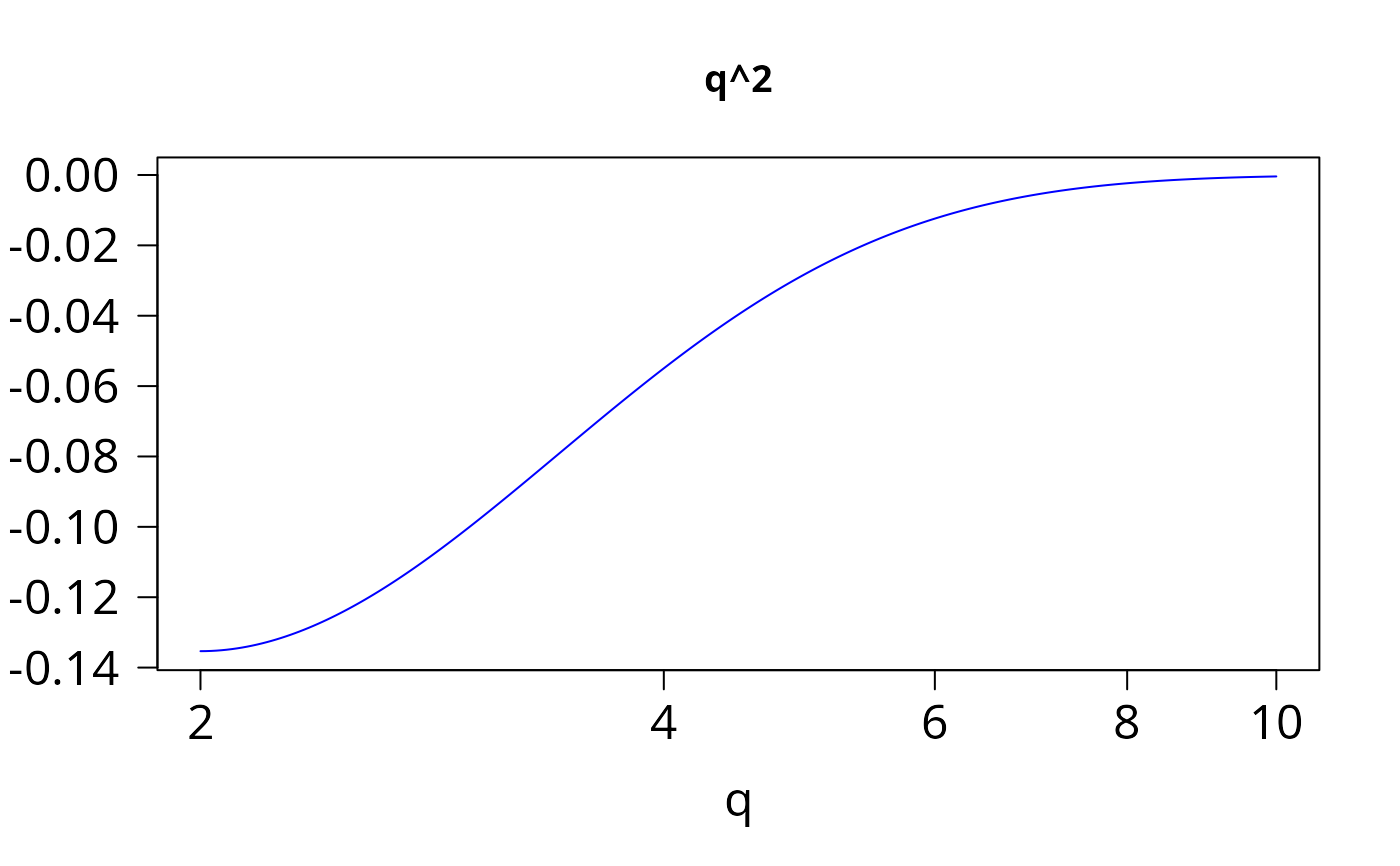
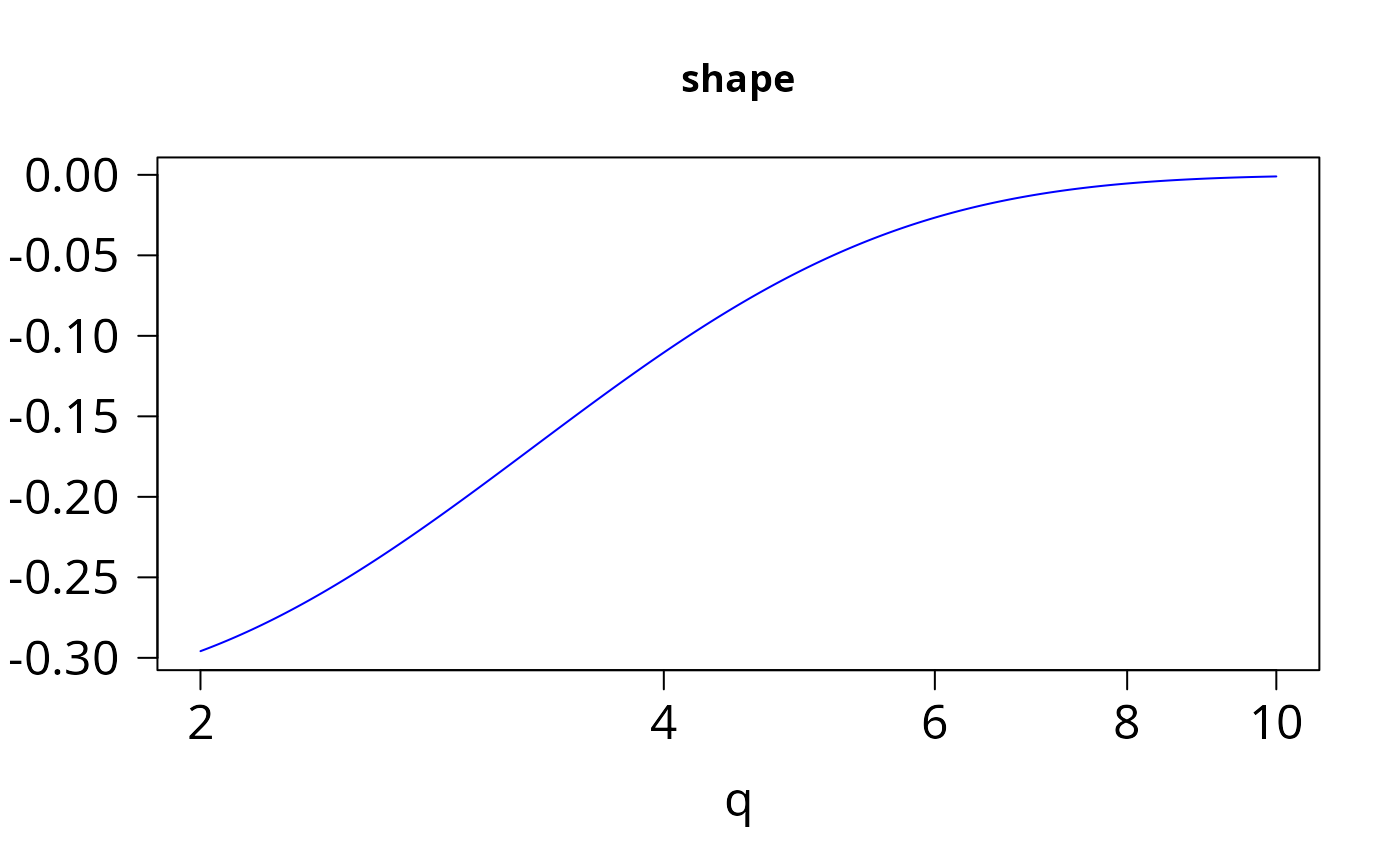
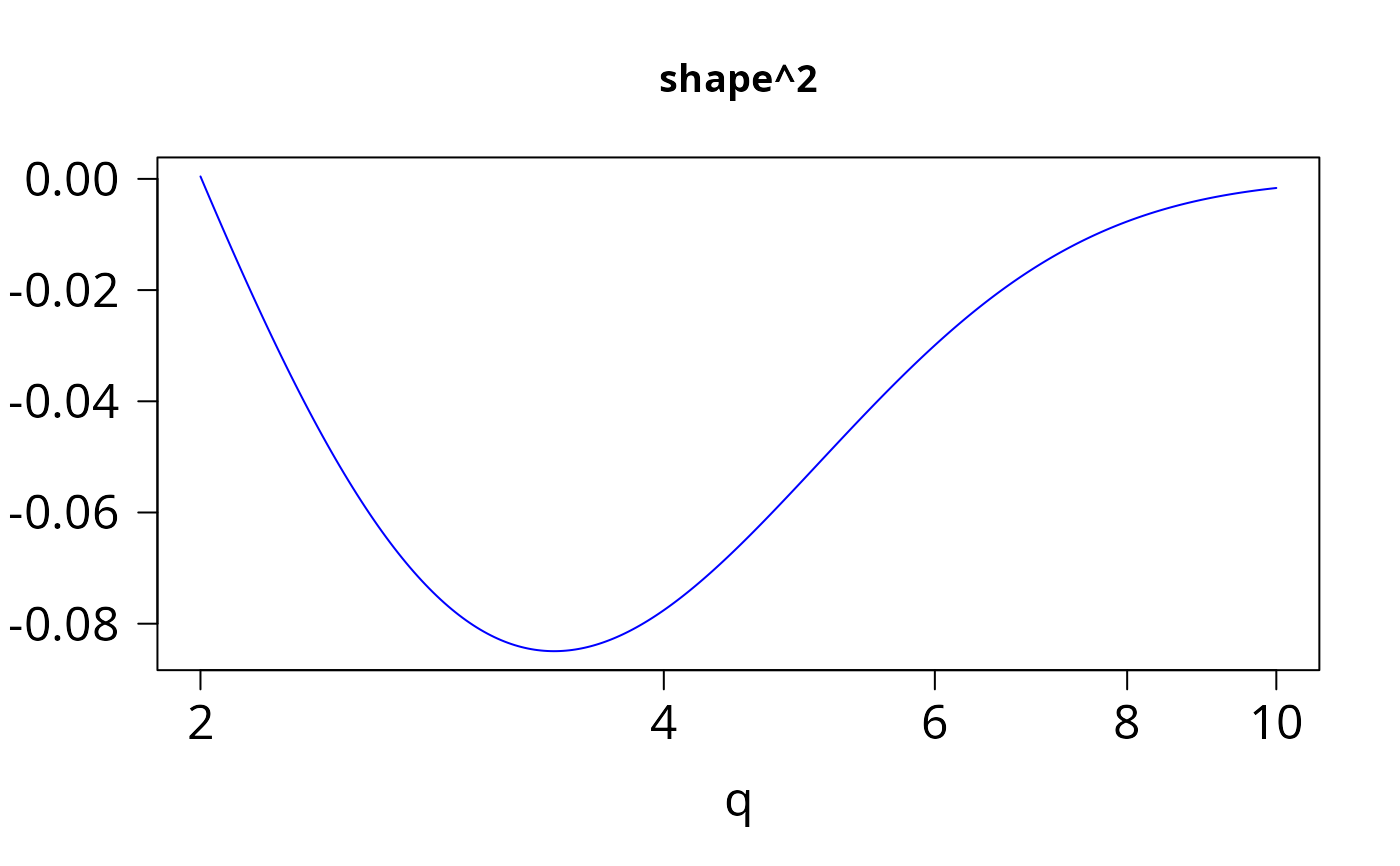
The first 5 columns, running from left to right, are the derivatives
with respect to:
\(x\),
\(x^2\),
\(a\),
\(a^2\),
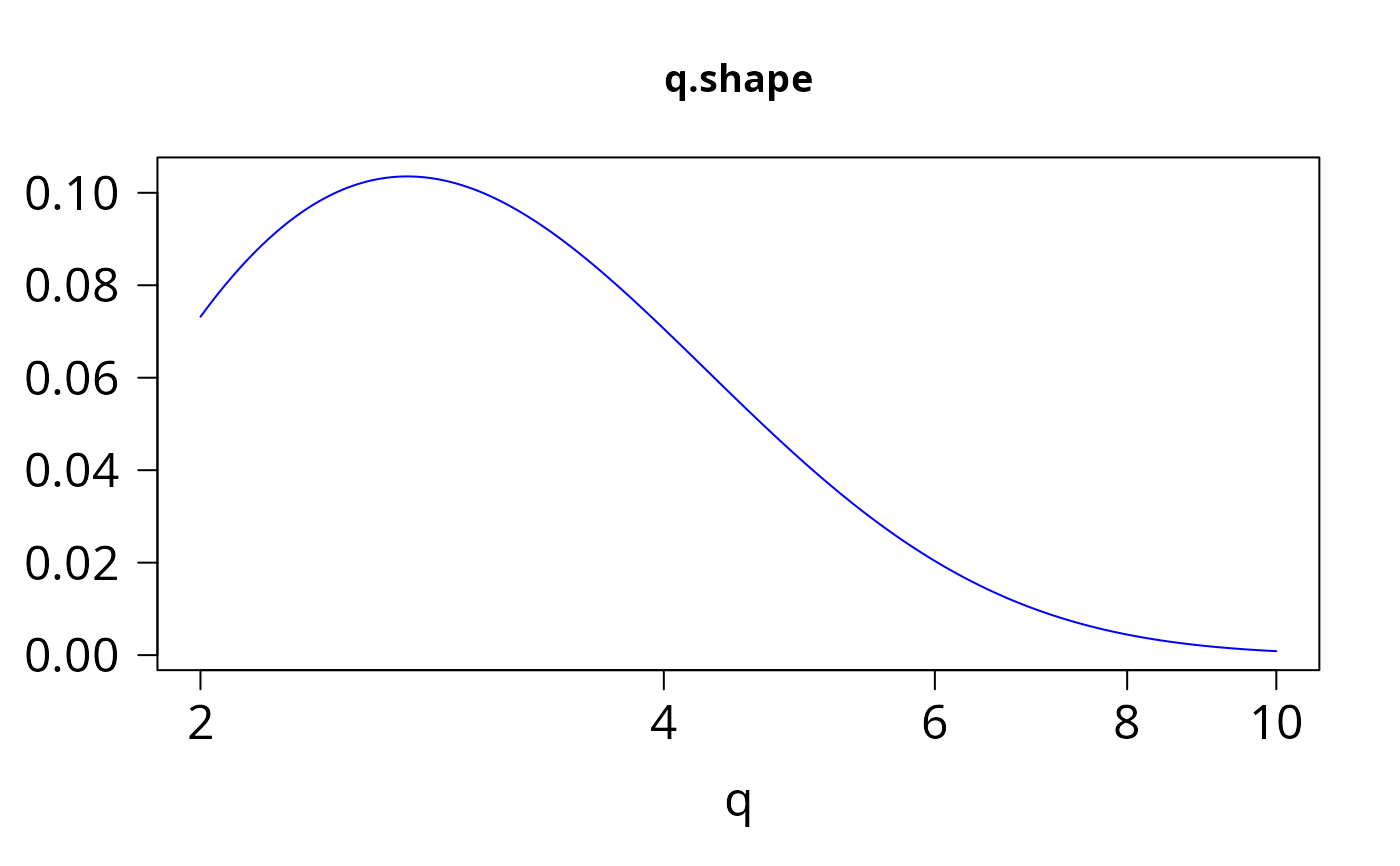
\(xa\).
The 6th column is \(P(a, x)\) (but it is not as accurate
as calling pgamma directly).
References
Moore, R. J. (1982). Algorithm AS 187: Derivatives of the Incomplete Gamma Integral. Journal of the Royal Statistical Society, Series C (Applied Statistics), 31(3), 330–335.
Author
T. W. Yee wrote the wrapper function to the Fortran subroutine
written by R. J. Moore. The subroutine was modified to run using
double precision.
The original code came from http://lib.stat.cmu.edu/apstat/187.
but this website has since become stale.
Note
If convergence does not occur then try increasing the value of
tmax.
Yet to do: add more arguments to give greater flexibility in the accuracy desired and to compute only quantities that are required by the user.
Examples
x <- seq(2, 10, length = 501)
head(ans <- pgamma.deriv(x, 2))
#>              q        q^2      shape       shape^2    q.shape pgamma(q, shape)
#> [1,] 0.2706706 -0.1353353 -0.2958549  0.0004420282 0.07317926        0.5939942
#> [2,] 0.2685053 -0.1353181 -0.2946052 -0.0018133884 0.07473335        0.5983076
#> [3,] 0.2663406 -0.1352675 -0.2933336 -0.0040379197 0.07623631        0.6025863
#> [4,] 0.2641769 -0.1351843 -0.2920409 -0.0062311686 0.07768898        0.6068305
#> [5,] 0.2620148 -0.1350697 -0.2907277 -0.0083927774 0.07909219        0.6110400
#> [6,] 0.2598548 -0.1349246 -0.2893947 -0.0105224259 0.08044679        0.6152149
if (FALSE)  par(mfrow = c(2, 3))
for (jay in 1:6)
  plot(x, ans[, jay], type = "l", col = "blue", cex.lab = 1.5,
       cex.axis = 1.5, las = 1, log = "x",
       main = colnames(ans)[jay], xlab = "q", ylab = "")  # \dontrun{}