wrapper to create a chart of rolling performance metrics in a line chart
Source:R/chart.RollingPerformance.R
chart.RollingPerformance.RdA wrapper to create a chart of rolling performance metrics in a line chart
chart.RollingPerformance(
  R,
  width = 12,
  FUN = "Return.annualized",
  ...,
  ylim = NULL,
  main = NULL,
  fill = NA
)
Arguments
- R
an xts, vector, matrix, data frame, timeSeries or zoo object of asset returns
- width
number of periods to apply rolling function window over
- FUN
any function that can be evaluated using a single set of returns (e.g., rolling
CAPM.betawon't work, butReturn.annualizedwill)- ...
any other passthru parameters to
plotor the function specified- ylim
set the y-axis limit, same as in
plot- main
set the chart title, same as in
plot- fill
a three-component vector or list (recycled otherwise) providing filling values at the left/within/to the right of the data range. See the fill argument of
na.fillfor details.
Details
The parameter na.pad has been deprecated; use fill = NA instead of na.pad = TRUE,
or fill = NULL instead of na.pad = FALSE.
See also
Examples
# \donttest{
data(edhec)
chart.RollingPerformance(edhec[, 1:3], width = 24)
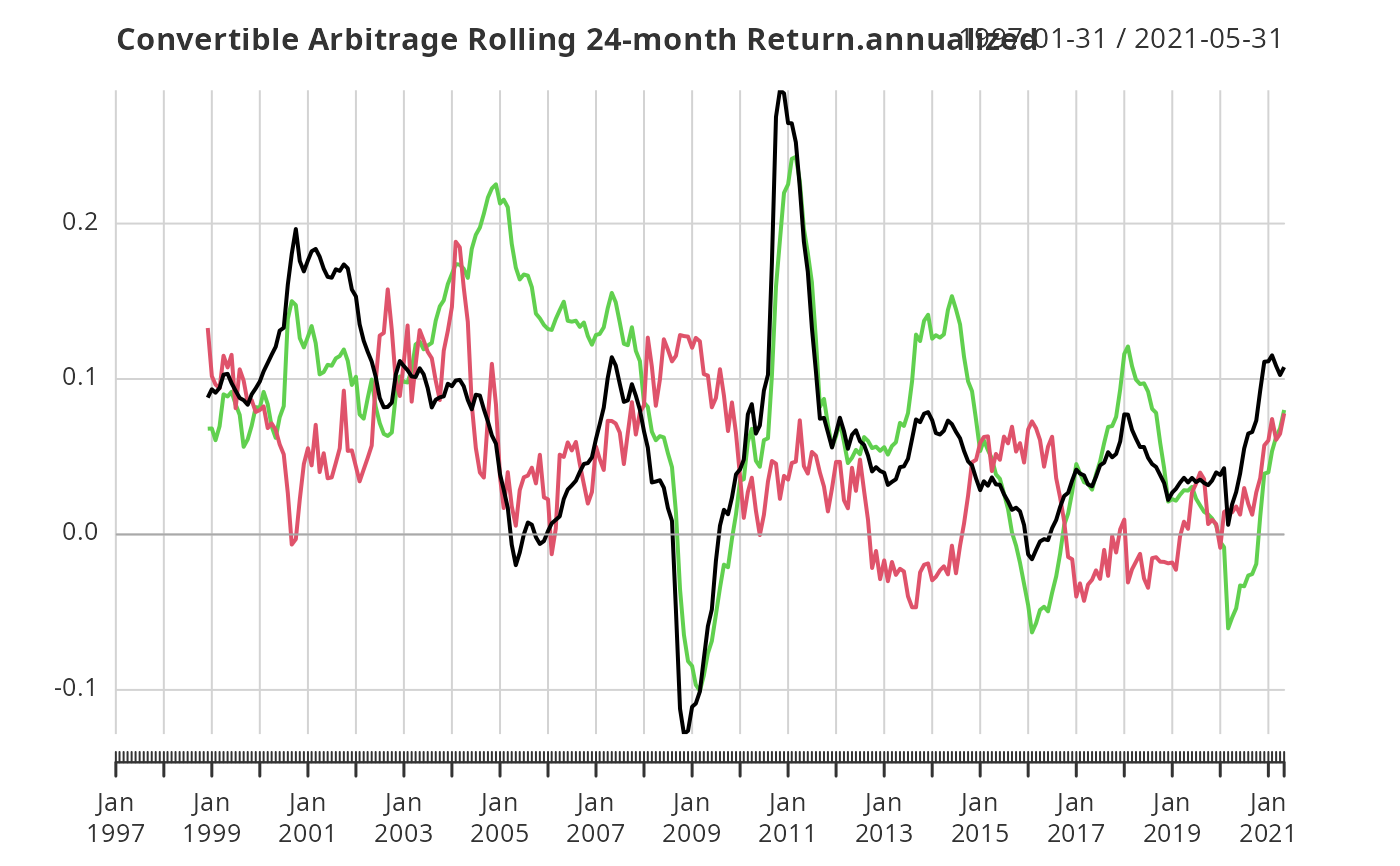 chart.RollingPerformance(edhec[, 1:3],
FUN = 'mean', width = 24, colorset = rich8equal,
lwd = 2, legend.loc = "topleft",
main = "Rolling 24-Month Mean Return")
chart.RollingPerformance(edhec[, 1:3],
FUN = 'mean', width = 24, colorset = rich8equal,
lwd = 2, legend.loc = "topleft",
main = "Rolling 24-Month Mean Return")
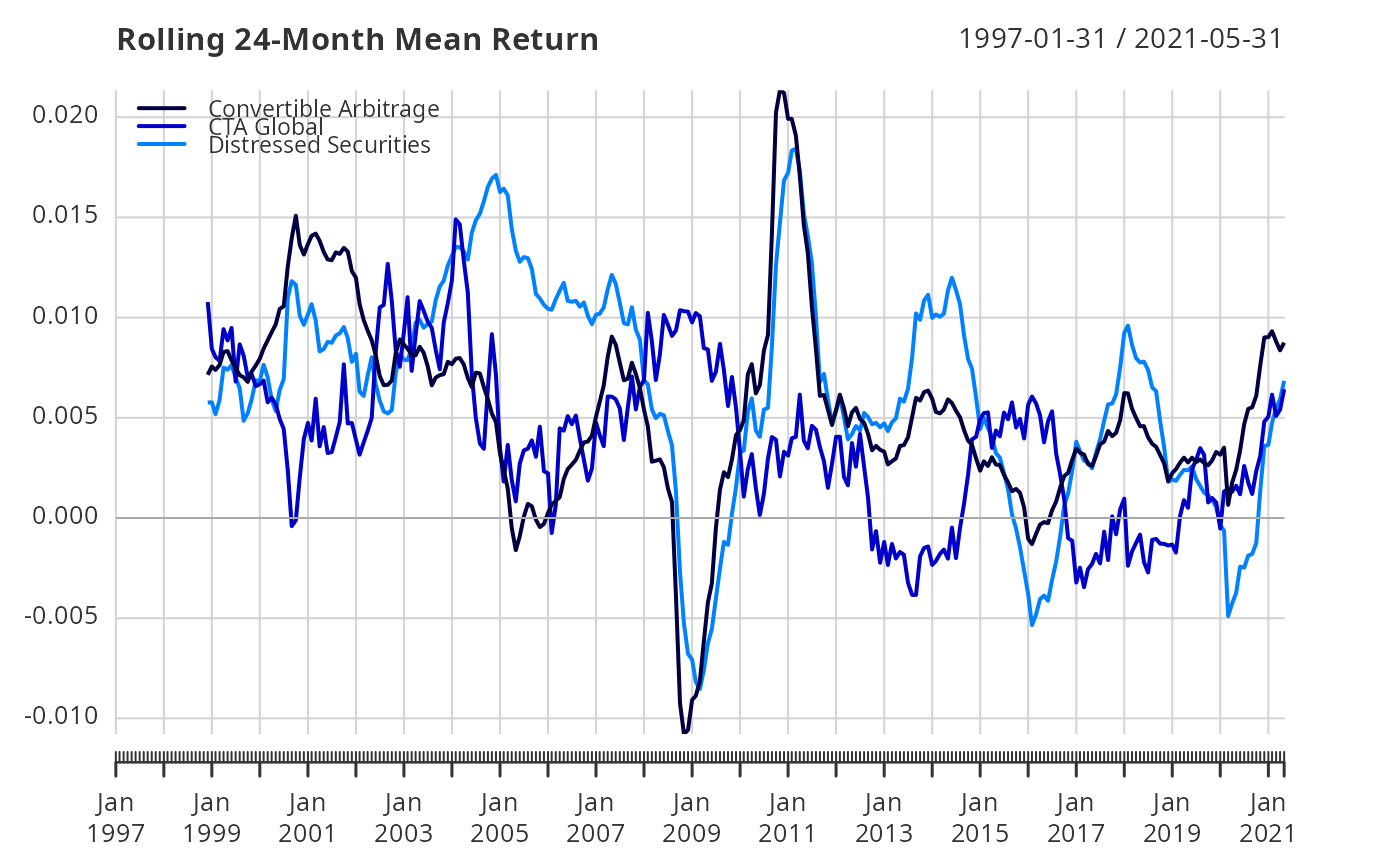 chart.RollingPerformance(edhec[, 1:3],
FUN = 'SharpeRatio.annualized', width = 24,
colorset = rich8equal, lwd = 2, legend.loc = "topleft",
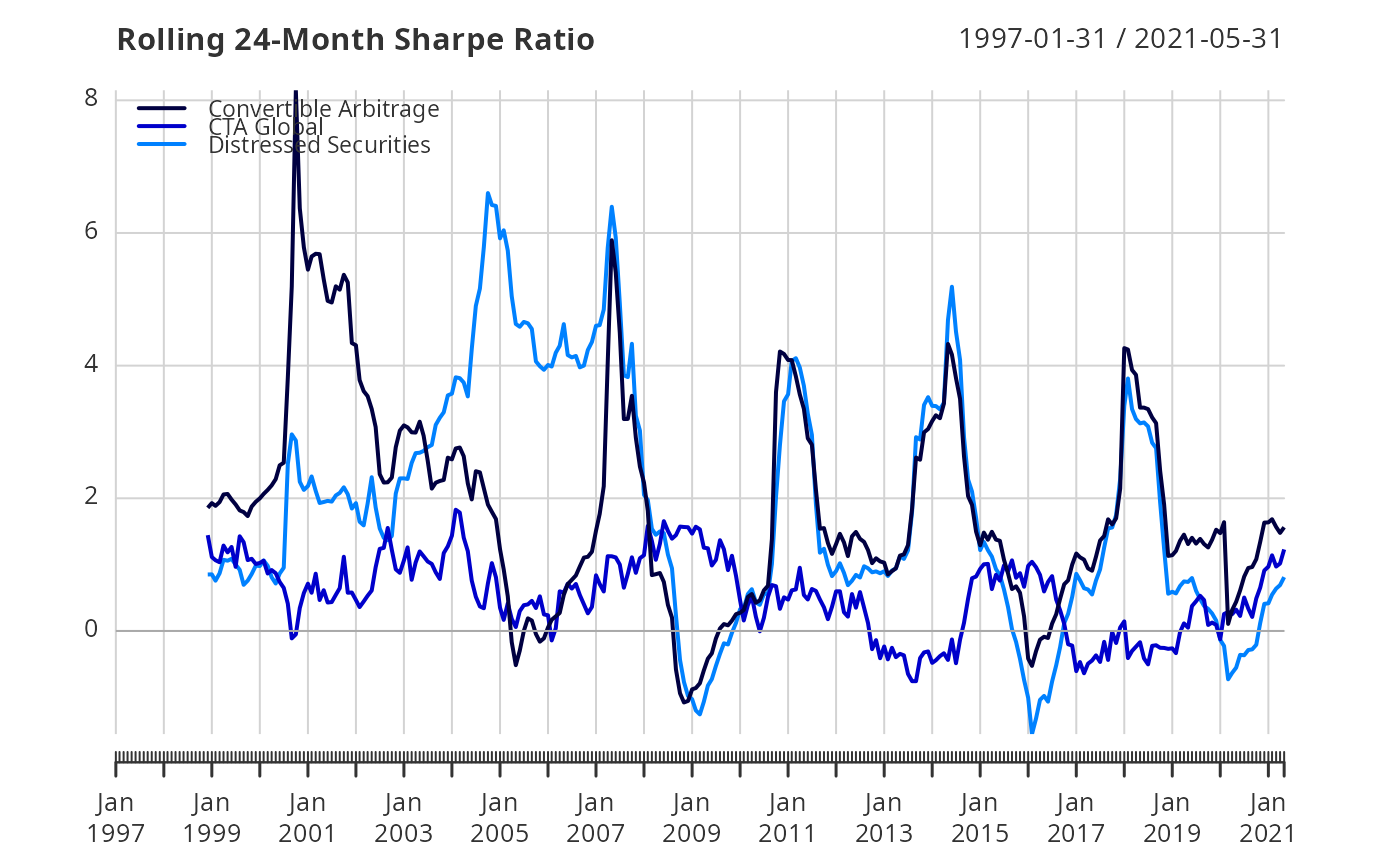
main = "Rolling 24-Month Sharpe Ratio")
chart.RollingPerformance(edhec[, 1:3],
FUN = 'SharpeRatio.annualized', width = 24,
colorset = rich8equal, lwd = 2, legend.loc = "topleft",
main = "Rolling 24-Month Sharpe Ratio")
 # }
# }