Flexible Event Chart for Time-to-Event Data
event.chart.RdCreates an event chart on the current graphics device. Also, allows user to plot legend on plot area or on separate page. Contains features useful for plotting data with time-to-event outcomes Which arise in a variety of studies including randomized clinical trials and non-randomized cohort studies. This function can use as input a matrix or a data frame, although greater utility and ease of use will be seen with a data frame.
Usage
event.chart(data, subset.r = 1:dim(data)[1], subset.c = 1:dim(data)[2],

           sort.by = NA, sort.ascending = TRUE,
           sort.na.last = TRUE, sort.after.subset = TRUE,
           y.var = NA, y.var.type = "n",
           y.jitter = FALSE, y.jitter.factor = 1,
           y.renum = FALSE, NA.rm = FALSE, x.reference = NA,
           now = max(data[, subset.c], na.rm = TRUE),
           now.line = FALSE, now.line.lty = 2,
           now.line.lwd = 1, now.line.col = 1, pty = "m",
           date.orig = c(1, 1, 1960), titl = "Event Chart",

           y.idlabels = NA, y.axis = "auto",
           y.axis.custom.at = NA, y.axis.custom.labels = NA,
           y.julian = FALSE, y.lim.extend = c(0, 0),
           y.lab = ifelse(is.na(y.idlabels), "", as.character(y.idlabels)),

           x.axis.all = TRUE, x.axis = "auto",
           x.axis.custom.at = NA, x.axis.custom.labels = NA,
           x.julian = FALSE, x.lim.extend = c(0, 0), x.scale = 1,
           x.lab = ifelse(x.julian, "Follow-up Time", "Study Date"),

           line.by = NA, line.lty = 1, line.lwd = 1, line.col = 1,
           line.add = NA, line.add.lty = NA,
           line.add.lwd = NA, line.add.col = NA,
           point.pch = 1:length(subset.c),
           point.cex = rep(0.6, length(subset.c)),
           point.col = rep(1, length(subset.c)),

           point.cex.mult = 1., point.cex.mult.var = NA,
           extra.points.no.mult = rep(NA, length(subset.c)),

           legend.plot = FALSE, legend.location = "o", legend.titl = titl,
           legend.titl.cex = 3, legend.titl.line = 1,
           legend.point.at = list(x = c(5, 95), y = c(95, 30)),
           legend.point.pch = point.pch,
           legend.point.text = ifelse(rep(is.data.frame(data), length(subset.c)),
                                      names(data[, subset.c]),
                                      subset.c),
           legend.cex = 2.5, legend.bty = "n",
           legend.line.at = list(x = c(5, 95), y = c(20, 5)),
           legend.line.text = names(table(as.character(data[, line.by]),
                                          exclude = c("", "NA"))),
           legend.line.lwd = line.lwd, legend.loc.num = 1,

           ...)
Arguments
- data
a matrix or data frame with rows corresponding to subjects and columns corresponding to variables. Note that for a data frame or matrix containing multiple time-to-event data (e.g., time to recurrence, time to death, and time to last follow-up), one column is required for each specific event.
- subset.r
subset of rows of original matrix or data frame to place in event chart. Logical arguments may be used here (e.g.,
treatment.arm == 'a', if the data frame, data, has been attached to the search directory; otherwise,data$treatment.arm == "a").- subset.c
subset of columns of original matrix or data frame to place in event chart; if working with a data frame, a vector of data frame variable names may be used for subsetting purposes (e.g.,
c('randdate', 'event1').- sort.by
column(s) or data frame variable name(s) with which to sort the chart's output. The default is
NA, thereby resulting in a chart sorted by original row number.- sort.ascending
logical flag (which takes effect only if the argument
sort.byis utilized). IfTRUE(default), sorting is done in ascending order; ifFALSE, descending order.- sort.na.last
logical flag (which takes effect only if the argument
sort.byis utilized). IfTRUE(default),NAvalues are considered as last values in ordering.- sort.after.subset
logical flag (which takes effect only if the argument sort.by is utilized). If
FALSE, sorting data (viasort.byspecified variables or columns) will be performed prior to row subsetting (viasubset.r); ifTRUE(default), row subsetting of original data will be done before sorting.- y.var
variable name or column number of original matrix or data frame with which to scale y-axis. Default is
NA, which will result in equally spaced lines on y-axis (based on original data or sorted data if requested by sort.by). Otherwise, location of lines on y-axis will be dictated by specified variable or column. Examples of specified variables may be date of an event or a physiological covariate. Any observation which has a missing value for the y.var variable will not appear on the graph.- y.var.type
type of variable specified in
y.var(which will only take effect if argumenty.varis utilized). If"d", specifed variable is a date (either numeric julian date or an S-Plus dates object); if"n", specifed variable is numeric (e.g., systolic blood pressure level) although not a julian date.- y.jitter
logical flag (which takes effect only if the argument
y.varis utilized). Due to potential ties iny.varvariable,y.jitter(whenTRUE) will jitter the data to allow discrimination between observations at the possible cost of producing slightly inaccurate dates or covariate values; ifFALSE(the default), no jittering will be performed. They.jitteralgorithm assumes a uniform distribution of observations across the range ofy.var. The algorithm is as follows:size.jitter <- ( diff(range(y.var)) / (2 * (length(y.var) - 1)) ) * y.jitter.factorThe default of
y.jitter.factoris 1. The entire product is then used as an argument intorunif:y.var <- y.var + runif(length(y.var), -size.jitter, size.jitter)- y.jitter.factor
an argument used with the
y.jitterfunction to scale the range of added noise. Default is 1.- y.renum
logical flag. If
TRUE, subset observations are listed on y-axis from 1 tolength(subset.r); ifFALSE(default), subset observations are listed on y-axis in original form. As an example, ifsubset.r = 301:340andy.renum ==TRUE, y-axis will be shown as 1 through 40. However, ify.renum ==FALSE, y-axis will be shown as 301 through 340. The above examples assume the following argument,NA.rm, is set toFALSE.- NA.rm
logical flag. If
TRUE, subset observations which haveNAfor each variable specified in subset.c will not have an entry on the y-axis. Also, if the following argument,x.reference, is specified, observations with missingx.referencevalues will also not have an entry on the y-axis. IfFALSE(default), user can identify those observations which do haveNAfor every variable specified insubset.c(or, ifx.referenceis specified, also those observations which are missing only thex.referencevalue); this can easily be done by examining the resulting y-axis and recognizing the observations without any plotting symbols.- x.reference
column of original matrix or data frame with which to reference the x-axis. That is, if specified, all columns specified in
subset.cwill be substracted byx.reference. An example may be to see the timing of events before and after treatment or to see time-to-event after entry into study. The event times will be aligned using thex.referenceargument as the reference point.- now
the “now” date which will be used for top of y-axis when creating the Goldman eventchart (see reference below). Default is
max(data[, subset.c], na.rm =TRUE).- now.line
logical flag. A feature utilized by the Goldman Eventchart. When
x.referenceis specified as the start of follow-up andy.var = x.reference, then the Goldman chart can be created. This argument, ifTRUE, will cause the plot region to be square, and will draw a line with a slope of -1 from the top of the y-axis to the right end of the x-axis. Essentially, it denotes end of current follow-up period for looking at the time-to-event data. Default isFALSE.- now.line.lty
line type of
now.line.- now.line.lwd
line width of
now.line.- now.line.col
color of
now.line.- pty
graph option,
pty='m'is the default; usepty='s'for the square looking Goldman's event chart.- date.orig
date of origin to consider if dates are in julian, SAS , or S-Plus dates object format; default is January 1, 1960 (which is the default origin used by both S-Plus and SAS). Utilized when either
y.julian = FALSEorx.julian = FALSE.- titl
title for event chart. Default is 'Event Chart'.
- y.idlabels
column or data frame variable name used for y-axis labels. For example, if
c('pt.no')is specified, patient ID (stored inpt.no) will be seen on y-axis labels instead of sequence specified bysubset.r. This argument takes precedence over bothy.axis = 'auto'andy.axis = 'custom'(see below). NOTE: Program will issue warning if this argument is specified and ifis.na(y.var) == FALSE;y.idlabelswill not be used in this situation. Also, attempting to plot too many patients on a single event chart will cause undesirable plotting ofy.idlabels.- y.axis
character string specifying whether program will control labelling of y-axis (with argument
"auto"), or if user will control labelling (with argument"custom"). If"custom"is chosen, user must specify location and text of labels usingy.axis.custom.atandy.axis.custom.labelsarguments, respectively, listed below. This argument will not be utilized ify.idlabelsis specified.- y.axis.custom.at
user-specified vector of y-axis label locations. Must be used when
y.axis = "custom"; will not be used otherwise.- y.axis.custom.labels
user-specified vector of y-axis labels. Must be used when
y.axis = "custom"; will not be used otherwise.- y.julian
logical flag (which will only be considered if
y.axis == "auto"and(!is.na(y.var) & y.var.type== "d"). IfFALSE(default), will convert julian numeric dates or S-Plus dates objects into “mm/dd/yy” format for the y-axis labels. IfTRUE, dates will be printed in julian (numeric) format.- y.lim.extend
two-dimensional vector representing the number of units that the user wants to increase
ylimon bottom and top of y-axis, respectively. Defaultc(0,0). This argument will not take effect if the Goldman chart is utilized.- y.lab
single label to be used for entire y-axis. Default will be the variable name or column number of
y.idlabels(if non-missing) and blank otherwise.- x.axis.all
logical flag. If
TRUE(default), lower and upper limits of x-axis will be based on all observations (rows) in matrix or data frame. IfFALSE, lower and upper limits will be based only on those observations specified bysubset.r(either before or after sorting depending on specification ofsort.byand value ofsort.after.subset).- x.axis
character string specifying whether program will control labelling of x-axis (with argument
"auto"), or if user will control labelling (with argument"custom"). If"custom"is chosen, user must specify location and text of labels usingx.axis.custom.atandx.axis.custom.labelsarguments, respectively, listed below.- x.axis.custom.at
user-specified vector of x-axis label locations. Must be used when
x.axis == "custom"; will not be used otherwise.- x.axis.custom.labels
user-specified vector of x-axis labels. Must be used when
x.axis == "custom"; will not be used otherwise.- x.julian
logical flag (which will only be considered if
x.axis == "auto"). IfFALSE(default), will convert julian dates or S-plus dates objects into “mm/dd/yy” format for the x-axis labels. IfTRUE, dates will be printed in julian (numeric) format. NOTE: This argument should remainTRUEifx.referenceis specified.- x.lim.extend
two-dimensional vector representing the number of time units (usually in days) that the user wants to increase
xlimon left-hand side and right-hand side of x-axis, respectively. Default isc(0,0). This argument will not take effect if the Goldman chart is utilized.- x.scale
a factor whose reciprocal is multiplied to original units of the x-axis. For example, if the original data frame is in units of days,
x.scale = 365will result in units of years (notwithstanding leap years). Default is 1.- x.lab
single label to be used for entire x-axis. Default will be “On Study Date” if
x.julian = FALSEand “Time on Study” ifx.julian = TRUE.- line.by
column or data frame variable name for plotting unique lines by unique values of vector (e.g., specify
c('arm')to plot unique lines by treatment arm). Can take at most one column or variable name. Default isNAwhich produces identical lines for each patient.- line.lty
vector of line types corresponding to ascending order of
line.byvalues. Ifline.byis specified, the vector should be the length of the number of unique values ofline.by. Ifline.byisNA, onlyline.lty[1]will be used. The default is 1.- line.lwd
vector of line widths corresponding to ascending order of
line.byvalues. Ifline.byis specified, the vector should be the length of the number of unique values ofline.by. Ifline.byisNA, onlyline.lwd[1]will be used. The default is 1.- line.col
vector of line colors corresponding to ascending order of
line.byvalues. Ifline.byis specified, the vector should be the length of the number of unique values ofline.by. Ifline.byisNA, onlyline.col[1]will be used. The default is 1.- line.add
a 2xk matrix with k=number of pairs of additional line segments to add. For example, if it is of interest to draw additional line segments connecting events one and two, two and three, and four and five, (possibly with different colors), an appropriate
line.addargument would bematrix(c('first.event','second.event','second.event','third.event', 'fourth.event','fifth.event'), 2, 3). One line segment would be drawn betweenfirst.eventandsecond.event, a second line segment would be drawn betweensecond.eventandthird.event, and a third line segment would be drawn betweenfourth.eventandfifth.event. Different line types, widths and colors can be specified (in arguments listed just below).The convention use of
subset.candline.addmust match (i.e., column name must be used for both or column number must be used for both).If
line.add != NA, length ofline.add.lty,line.add.lwd, andline.add.colmust be the same as number of pairs of additional line segments to add.NOTE: The drawing of the original default line may be suppressed (with
line.col = 0), andline.addcan be used to do all the line plotting for the event chart.- line.add.lty
a kx1 vector corresponding to the columns of
line.add; specifies the line types for the k line segments.- line.add.lwd
a kx1 vector corresponding to the columns of
line.add; specifies the line widths for the k line segments.- line.add.col
a kx1 vector corresponding to the columns of
line.add; specifies the line colors for the k line segments.- point.pch
vector of
pchvalues for points representing each event. If similar events are listed in multiple columns (e.g., regular visits or a recurrent event), repeatedpchvalues may be listed in the vector (e.g.,c(2,4,rep(183,3))). Iflength(point.pch) < length(subset.c),point.pchwill be repeated until lengths are equal; a warning message will verify this condition.- point.cex
vector of size of points representing each event. If
length(point.cex) < length(subset.c),point.cexwill be repeated until lengths are equal; a warning message will verify this condition.- point.col
vector of colors of points representing each event. If
length(point.col) < length(subset.c),point.colwill be repeated until lengths are equal; a warning message will verify this condition.- point.cex.mult
a single number (may be non-integer), which is the base multiplier for the value of the
cexof the plotted points, when interest lies in a variable size allowed for certain points, as a function of the quantity of the variable(s) in the dataset specified in thepoint.cex.mult.varargument; multiplied by originalpoint.cexvalue and then the value of interest (for an individual) from thepoint.cex.mult.var argument; used only when non-NAarguments are provided topoint.cex.mult.var; default is 1. .- point.cex.mult.var
vector of variables to be used in determining what point.cex.mult is multiplied by for determining size of plotted points from (possibly a subset of)
subset.cvariables, when interest lies in a variable size allowed for certain points, as a function of the level of some variable(s) in the dataset; default isNA.- extra.points.no.mult
vector of variables in the dataset to ignore for purposes of using
point.cex.mult; for example, for some variables there may be interest in allowing a variable size allowed for the plotting of the points, whereas other variables (e.g., dropout time), there may be no interest in such manipulation; the vector should be the same size as the number of variables specified insubset.c, withNAentries where variable point size is of interest and the variable name (or location insubset.c) specified when the variable point size is not of interest; in this latter case, the associated argument inpoint.cexis instead used as the pointcex; used only when non-NAarguments are provided topoint.cex.mult.var; default isNA- legend.plot
logical flag; if
TRUE, a legend will be plotted. Location of legend will be based on specification of legend.location along with values of other arguments listed below. Default isFALSE(i.e., no legend plotting).- legend.location
will be used only if
legend.plot = TRUE. If"o"(default), a one-page legend will precede the output of the chart. The user will need to hit enter in order for the event chart to be displayed. This feature is possible due to thedev.askoption. If"i", an internal legend will be placed in the plot region based onlegend.point.at. If"l", a legend will be placed in the plot region using the locator option. Legend will map points to events (via column names, by default) and, ifline.byis specified, lines to groups (based on levels ofline.by).- legend.titl
title for the legend; default is title to be used for main plot. Only used when
legend.location = "o".- legend.titl.cex
size of text for legend title. Only used when
legend.location = "o".- legend.titl.line
line location of legend title dictated by
mtextfunction withouter = FALSEoption; default is 1.0. Only used whenlegend.location = "o".- legend.point.at
location of upper left and lower right corners of legend area to be utilized for describing events via points and text.
- legend.point.pch
vector of
pchvalues for points representing each event in the legend. Default ispoint.pch.- legend.point.text
text to be used for describing events; the default is setup for a data frame, as it will print the names of the columns specified by
subset.c.- legend.cex
size of text for points and event descriptions. Default is 2.5 which is setup for
legend.location = "o". A much smallercexis recommended (possibly 0.75) for use withlegend.location = "i"orlegend.location = "l".- legend.bty
option to put a box around the legend(s); default is to have no box (
legend.bty = "n"). Optionlegend.bty = "o"will produce a legend box.- legend.line.at
if
line.bywas specified (withlegend.location = "o"orlegend.location = "i"), this argument will dictate the location of the upper left and lower right corners of legend area to be utilized for describing the differentline.byvalues (e.g.,treatment.arm). The default is setup forlegend.location = "o".- legend.line.text
text to be used for describing
line.byvalues; the default are the names of the unique non-missingline.byvalues as produced from the table function.- legend.line.lwd
vector of line widths corresponding to
line.byvalues.- legend.loc.num
number used for locator argument when
legend.locator = "l". If 1 (default), user is to locate only the top left corner of the legend box. If 2, user is to locate both the top left corner and the lower right corner. This will be done twice whenline.byis specified (once for points and once for lines).- ...
additional par arguments for use in main plot.
Side Effects
an event chart is created on the current graphics device. If legend.plot =TRUE and legend.location = 'o', a one-page legend will precede the event chart. Please note that par parameters on completion of function will be reset to par parameters existing prior to start of function.
Details
if you want to put, say, two eventcharts side-by-side, in a plot
region, you should not set up par(mfrow=c(1,2)) before running the
first plot. Instead, you should add the argument mfg=c(1,1,1,2)
to the first plot call followed by the argument mfg=c(1,2,1,2)
to the second plot call.
if dates in original data frame are in a specialized form
(eg., mm/dd/yy) of mode CHARACTER, the user must convert those columns to
become class dates or julian numeric mode (see Date for more information).
For example, in a data frame called testdata, with specialized
dates in columns 4 thru 10, the following code could be used:
as.numeric(dates(testdata[,4:10])). This will convert the columns
to numeric julian dates based on the function's default origin
of January 1, 1960. If original dates are in class dates or julian form,
no extra work is necessary.
In the survival analysis, the data typically come in two
columns: one column containing survival time and the other
containing censoring indicator or event code. The
event.convert function converts this type of data into
multiple columns of event times, one column of each event
type, suitable for the event.chart function.
Author
J. Jack Lee and Kenneth R. Hess
Department of Biostatistics
University of Texas
M.D. Anderson Cancer Center
Houston, TX 77030
jjlee@mdanderson.org, khess@mdanderson.org
Joel A. Dubin
Department of Statistics
University of Waterloo
jdubin@uwaterloo.ca
References
Lee J.J., Hess, K.R., Dubin, J.A. (2000). Extensions and applications of event charts. The American Statistician, 54:1, 63–70.
Dubin, J.A., Lee, J.J., Hess, K.R. (1997). The Utility of Event Charts. Proceedings of the Biometrics Section, American Statistical Association.
Dubin, J.A., Muller H-G, Wang J-L (2001). Event history graphs for censored survival data. Statistics in Medicine, 20: 2951–2964.
Goldman, A.I. (1992). EVENTCHARTS: Visualizing Survival and Other Timed-Events Data. The American Statistician, 46:1, 13–18.
Examples
# The sample data set is an augmented CDC AIDS dataset (ASCII)
# which is used in the examples in the help file. This dataset is
# described in Kalbfleisch and Lawless (JASA, 1989).
# Here, we have included only children 4 years old and younger.
# We have also added a new field, dethdate, which
# represents a fictitious death date for each patient. There was
# no recording of death date on the original dataset. In addition, we have
# added a fictitious viral load reading (copies/ml) for each patient at time of AIDS diagnosis,
# noting viral load was also not part of the original dataset.
#
# All dates are julian with julian=0 being
# January 1, 1960, and julian=14000 being 14000 days beyond
# January 1, 1960 (i.e., May 1, 1998).
cdcaids <- data.frame(
age=c(4,2,1,1,2,2,2,4,2,1,1,3,2,1,3,2,1,2,4,2,2,1,4,2,4,1,4,2,1,1,3,3,1,3),
infedate=c(
7274,7727,7949,8037,7765,8096,8186,7520,8522,8609,8524,8213,8455,8739,
8034,8646,8886,8549,8068,8682,8612,9007,8461,8888,8096,9192,9107,9001,
9344,9155,8800,8519,9282,8673),
diagdate=c(
8100,8158,8251,8343,8463,8489,8554,8644,8713,8733,8854,8855,8863,8983,
9035,9037,9132,9164,9186,9221,9224,9252,9274,9404,9405,9433,9434,9470,
9470,9472,9489,9500,9585,9649),
diffdate=c(
826,431,302,306,698,393,368,1124,191,124,330,642,408,244,1001,391,246,
615,1118,539,612,245,813,516,1309,241,327,469,126,317,689,981,303,976),
dethdate=c(
8434,8304,NA,8414,8715,NA,8667,9142,8731,8750,8963,9120,9005,9028,9445,
9180,9189,9406,9711,9453,9465,9289,9640,9608,10010,9488,9523,9633,9667,
9547,9755,NA,9686,10084),
censdate=c(
NA,NA,8321,NA,NA,8519,NA,NA,NA,NA,NA,NA,NA,NA,NA,NA,NA,NA,NA,NA,NA,NA,
NA,NA,NA,NA,NA,NA,NA,NA,NA,10095,NA,NA),
viralload=c(
13000,36000,70000,90000,21000,110000,75000,12000,125000,110000,13000,39000,79000,135000,14000,
42000,123000,20000,12000,18000,16000,140000,16000,58000,11000,120000,85000,31000,24000,115000,
17000,13100,72000,13500)
)
cdcaids <- upData(cdcaids,
labels=c(age ='Age, y', infedate='Date of blood transfusion',
diagdate='Date of AIDS diagnosis',
diffdate='Incubation period (days from HIV to AIDS)',
dethdate='Fictitious date of death',
censdate='Fictitious censoring date',
viralload='Fictitious viral load'))
#> Input object size: 3416 bytes; 7 variables 34 observations
#> New object size: 6264 bytes; 7 variables 34 observations
# Note that the style options listed with these
# examples are best suited for output to a postscript file (i.e., using
# the postscript function with horizontal=TRUE) as opposed to a graphical
# window (e.g., motif).
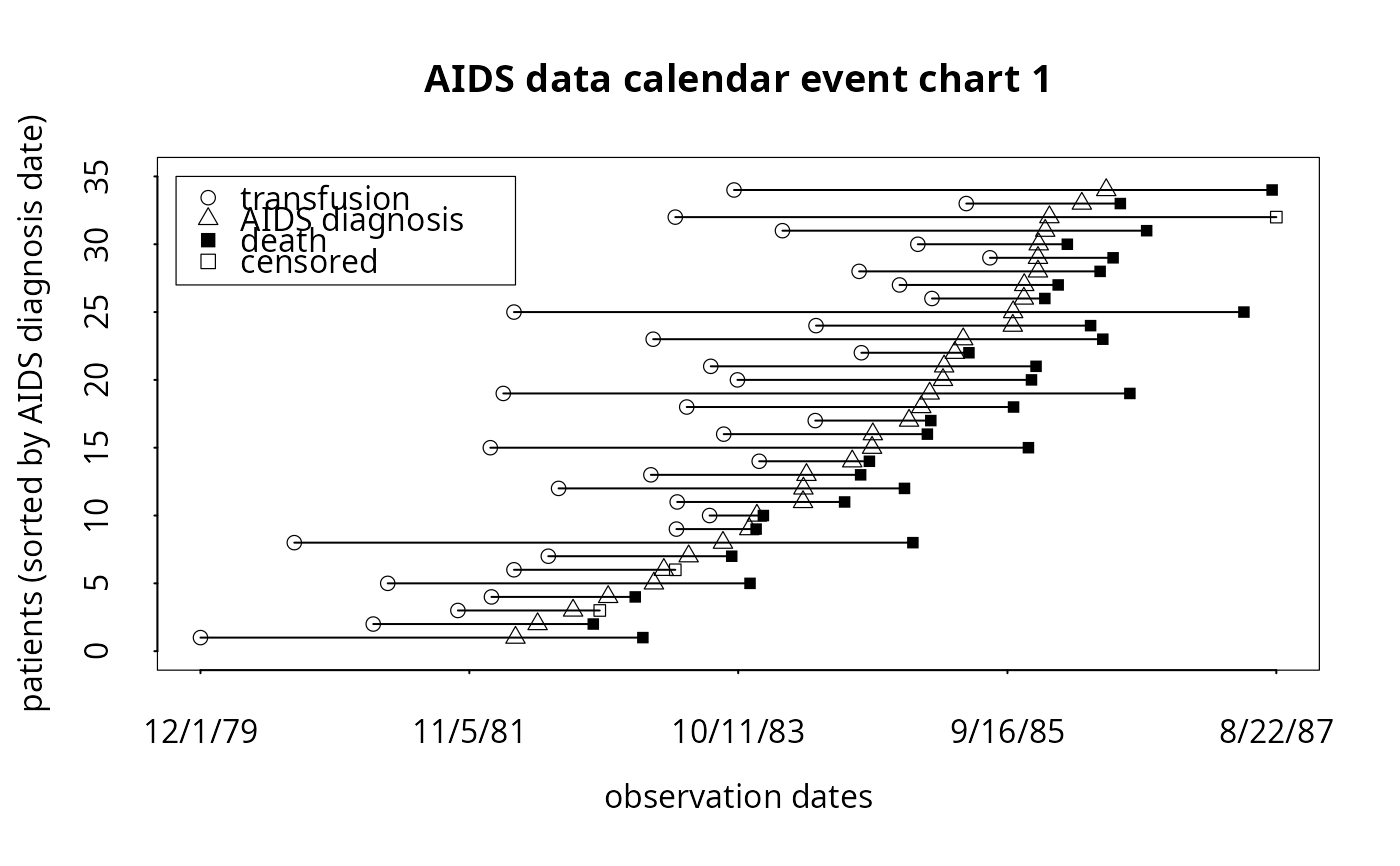
# To produce simple calendar event chart (with internal legend):
# postscript('example1.ps', horizontal=TRUE)
event.chart(cdcaids,
subset.c=c('infedate','diagdate','dethdate','censdate'),
x.lab = 'observation dates',
y.lab='patients (sorted by AIDS diagnosis date)',
titl='AIDS data calendar event chart 1',
point.pch=c(1,2,15,0), point.cex=c(1,1,0.8,0.8),
legend.plot=TRUE, legend.location='i', legend.cex=1.0,
legend.point.text=c('transfusion','AIDS diagnosis','death','censored'),
legend.point.at = list(c(7210, 8100), c(35, 27)), legend.bty='o')
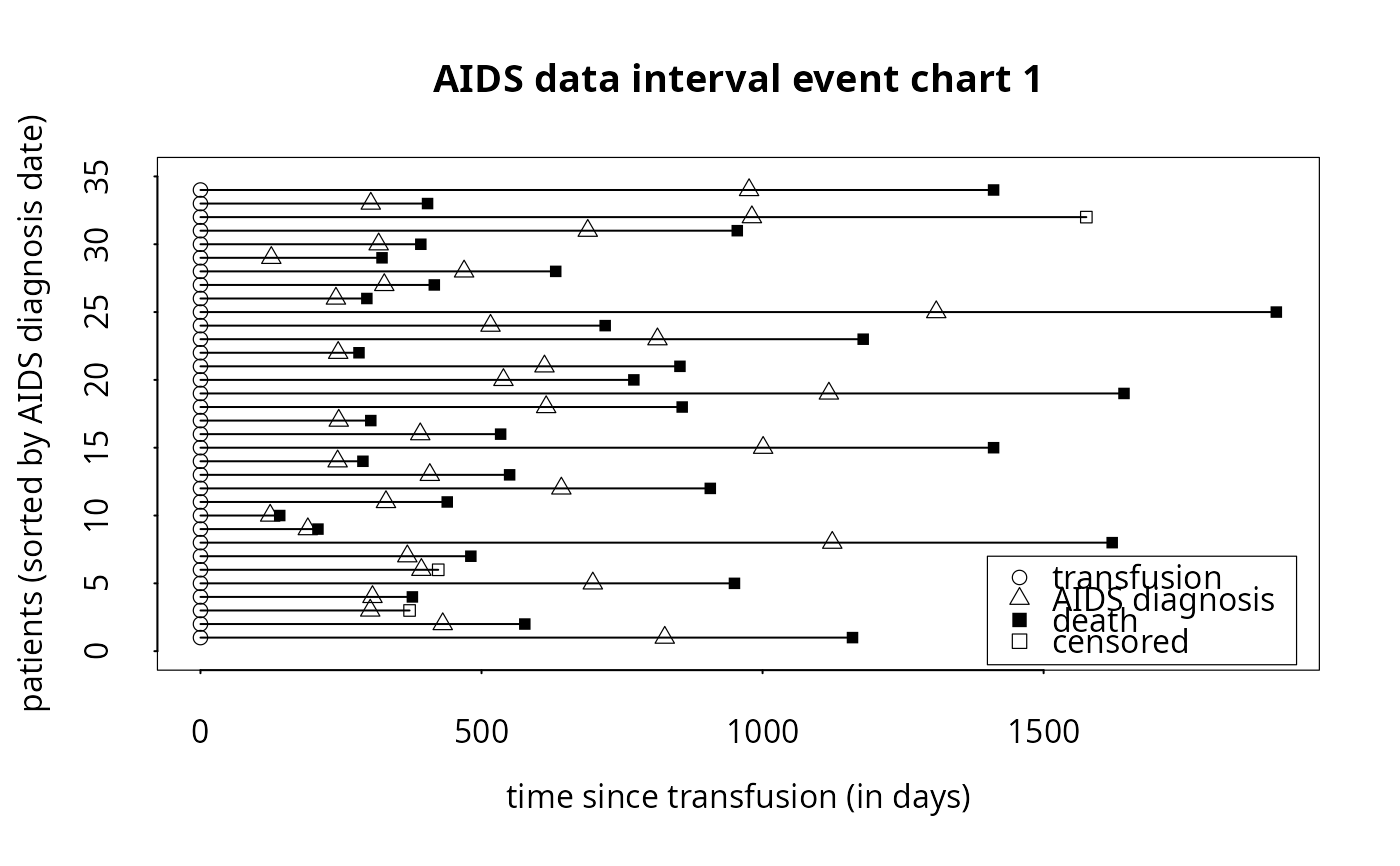
 # To produce simple interval event chart (with internal legend):
# postscript('example2.ps', horizontal=TRUE)
event.chart(cdcaids,
subset.c=c('infedate','diagdate','dethdate','censdate'),
x.lab = 'time since transfusion (in days)',
y.lab='patients (sorted by AIDS diagnosis date)',
titl='AIDS data interval event chart 1',
point.pch=c(1,2,15,0), point.cex=c(1,1,0.8,0.8),
legend.plot=TRUE, legend.location='i', legend.cex=1.0,
legend.point.text=c('transfusion','AIDS diagnosis','death','censored'),
x.reference='infedate', x.julian=TRUE,
legend.bty='o', legend.point.at = list(c(1400, 1950), c(7, -1)))
# To produce simple interval event chart (with internal legend):
# postscript('example2.ps', horizontal=TRUE)
event.chart(cdcaids,
subset.c=c('infedate','diagdate','dethdate','censdate'),
x.lab = 'time since transfusion (in days)',
y.lab='patients (sorted by AIDS diagnosis date)',
titl='AIDS data interval event chart 1',
point.pch=c(1,2,15,0), point.cex=c(1,1,0.8,0.8),
legend.plot=TRUE, legend.location='i', legend.cex=1.0,
legend.point.text=c('transfusion','AIDS diagnosis','death','censored'),
x.reference='infedate', x.julian=TRUE,
legend.bty='o', legend.point.at = list(c(1400, 1950), c(7, -1)))
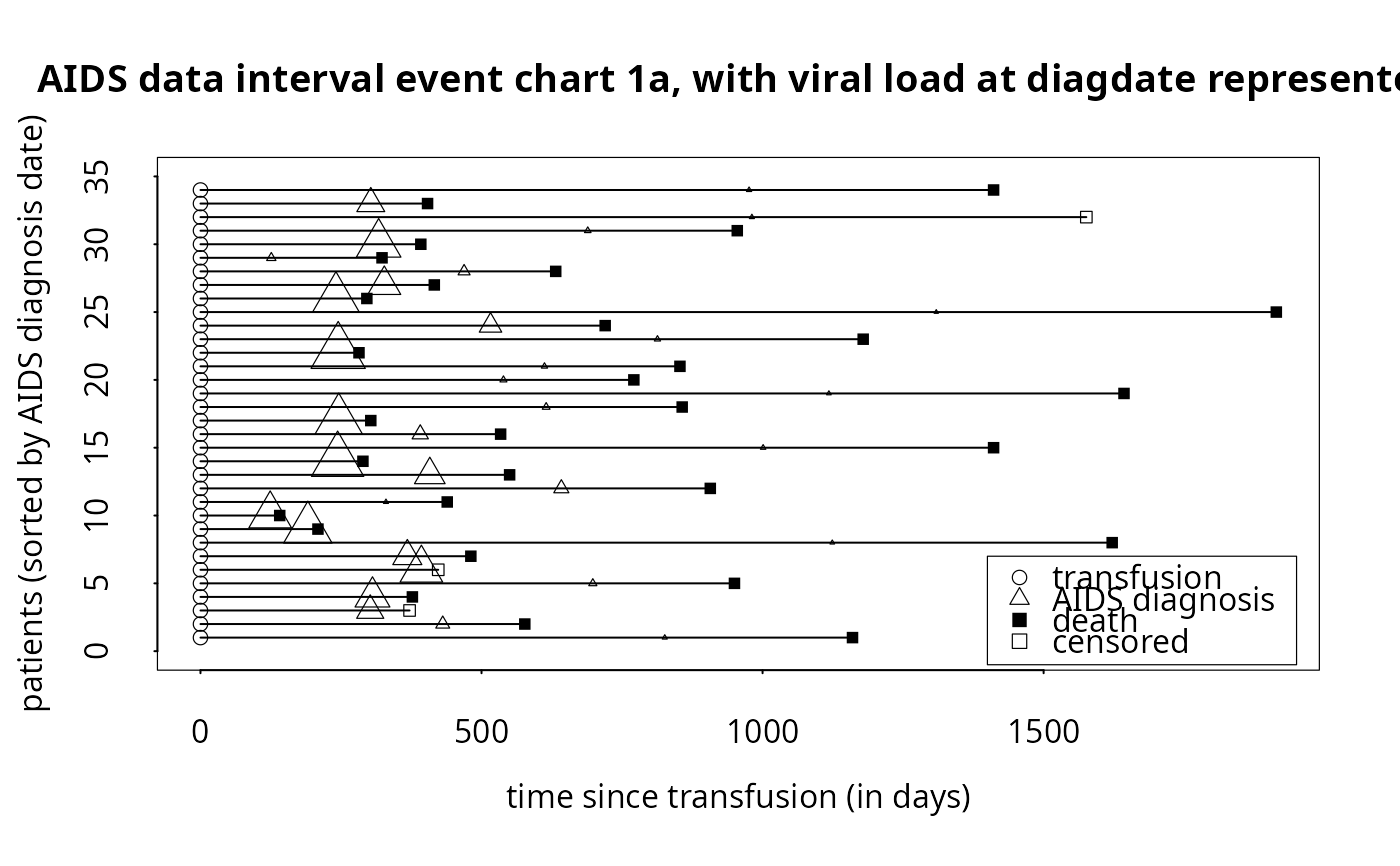
 # To produce simple interval event chart (with internal legend),
# but now with flexible diagdate symbol size based on viral load variable:
# postscript('example2a.ps', horizontal=TRUE)
event.chart(cdcaids,
subset.c=c('infedate','diagdate','dethdate','censdate'),
x.lab = 'time since transfusion (in days)',
y.lab='patients (sorted by AIDS diagnosis date)',
titl='AIDS data interval event chart 1a, with viral load at diagdate represented',
point.pch=c(1,2,15,0), point.cex=c(1,1,0.8,0.8),
point.cex.mult = 0.00002, point.cex.mult.var = 'viralload', extra.points.no.mult = c(1,NA,1,1),
legend.plot=TRUE, legend.location='i', legend.cex=1.0,
legend.point.text=c('transfusion','AIDS diagnosis','death','censored'),
x.reference='infedate', x.julian=TRUE,
legend.bty='o', legend.point.at = list(c(1400, 1950), c(7, -1)))
# To produce simple interval event chart (with internal legend),
# but now with flexible diagdate symbol size based on viral load variable:
# postscript('example2a.ps', horizontal=TRUE)
event.chart(cdcaids,
subset.c=c('infedate','diagdate','dethdate','censdate'),
x.lab = 'time since transfusion (in days)',
y.lab='patients (sorted by AIDS diagnosis date)',
titl='AIDS data interval event chart 1a, with viral load at diagdate represented',
point.pch=c(1,2,15,0), point.cex=c(1,1,0.8,0.8),
point.cex.mult = 0.00002, point.cex.mult.var = 'viralload', extra.points.no.mult = c(1,NA,1,1),
legend.plot=TRUE, legend.location='i', legend.cex=1.0,
legend.point.text=c('transfusion','AIDS diagnosis','death','censored'),
x.reference='infedate', x.julian=TRUE,
legend.bty='o', legend.point.at = list(c(1400, 1950), c(7, -1)))
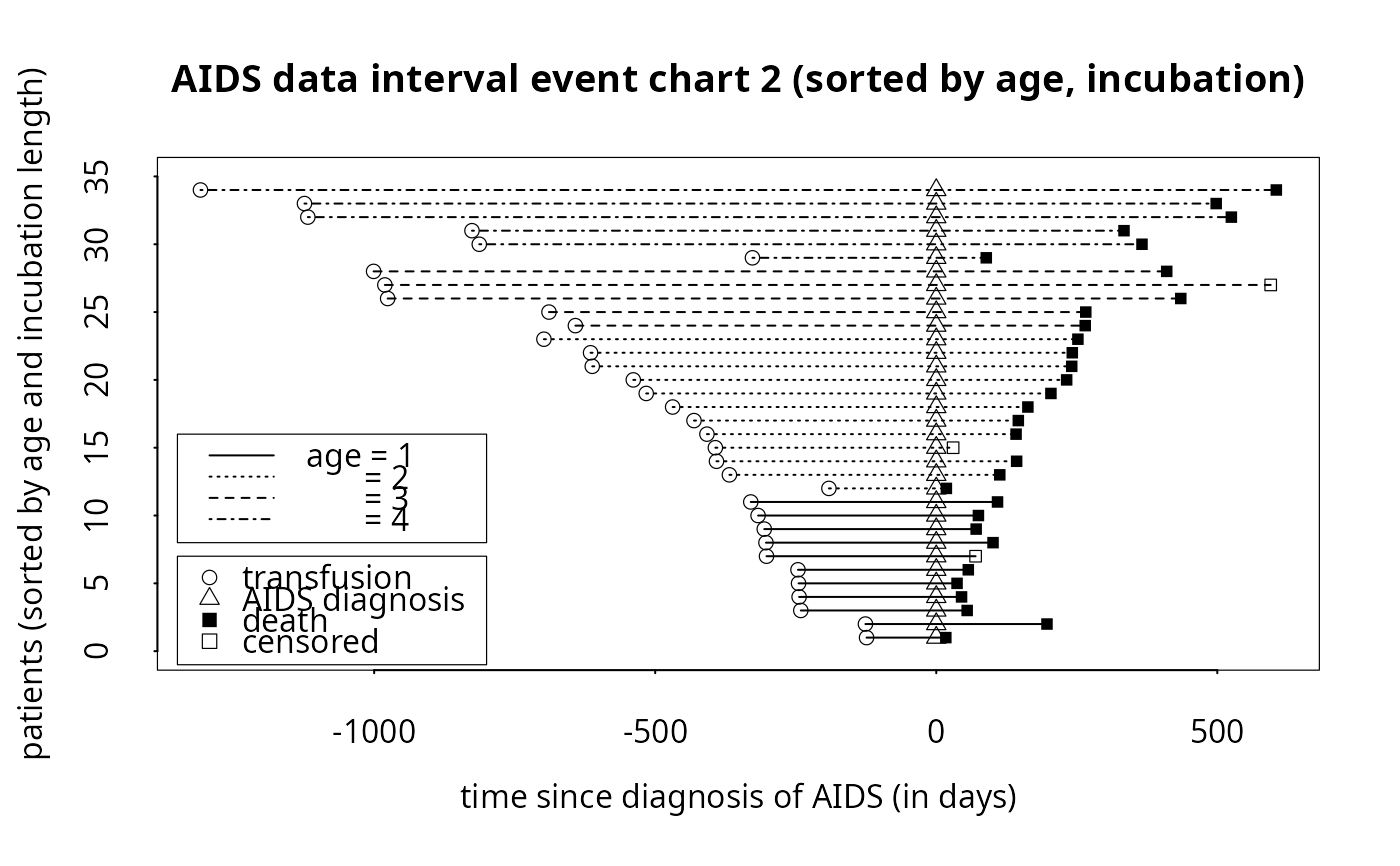
 # To produce more complicated interval chart which is
# referenced by infection date, and sorted by age and incubation period:
# postscript('example3.ps', horizontal=TRUE)
event.chart(cdcaids,
subset.c=c('infedate','diagdate','dethdate','censdate'),
x.lab = 'time since diagnosis of AIDS (in days)',
y.lab='patients (sorted by age and incubation length)',
titl='AIDS data interval event chart 2 (sorted by age, incubation)',
point.pch=c(1,2,15,0), point.cex=c(1,1,0.8,0.8),
legend.plot=TRUE, legend.location='i',legend.cex=1.0,
legend.point.text=c('transfusion','AIDS diagnosis','death','censored'),
x.reference='diagdate', x.julian=TRUE, sort.by=c('age','diffdate'),
line.by='age', line.lty=c(1,3,2,4), line.lwd=rep(1,4), line.col=rep(1,4),
legend.bty='o', legend.point.at = list(c(-1350, -800), c(7, -1)),
legend.line.at = list(c(-1350, -800), c(16, 8)),
legend.line.text=c('age = 1', ' = 2', ' = 3', ' = 4'))
# To produce more complicated interval chart which is
# referenced by infection date, and sorted by age and incubation period:
# postscript('example3.ps', horizontal=TRUE)
event.chart(cdcaids,
subset.c=c('infedate','diagdate','dethdate','censdate'),
x.lab = 'time since diagnosis of AIDS (in days)',
y.lab='patients (sorted by age and incubation length)',
titl='AIDS data interval event chart 2 (sorted by age, incubation)',
point.pch=c(1,2,15,0), point.cex=c(1,1,0.8,0.8),
legend.plot=TRUE, legend.location='i',legend.cex=1.0,
legend.point.text=c('transfusion','AIDS diagnosis','death','censored'),
x.reference='diagdate', x.julian=TRUE, sort.by=c('age','diffdate'),
line.by='age', line.lty=c(1,3,2,4), line.lwd=rep(1,4), line.col=rep(1,4),
legend.bty='o', legend.point.at = list(c(-1350, -800), c(7, -1)),
legend.line.at = list(c(-1350, -800), c(16, 8)),
legend.line.text=c('age = 1', ' = 2', ' = 3', ' = 4'))
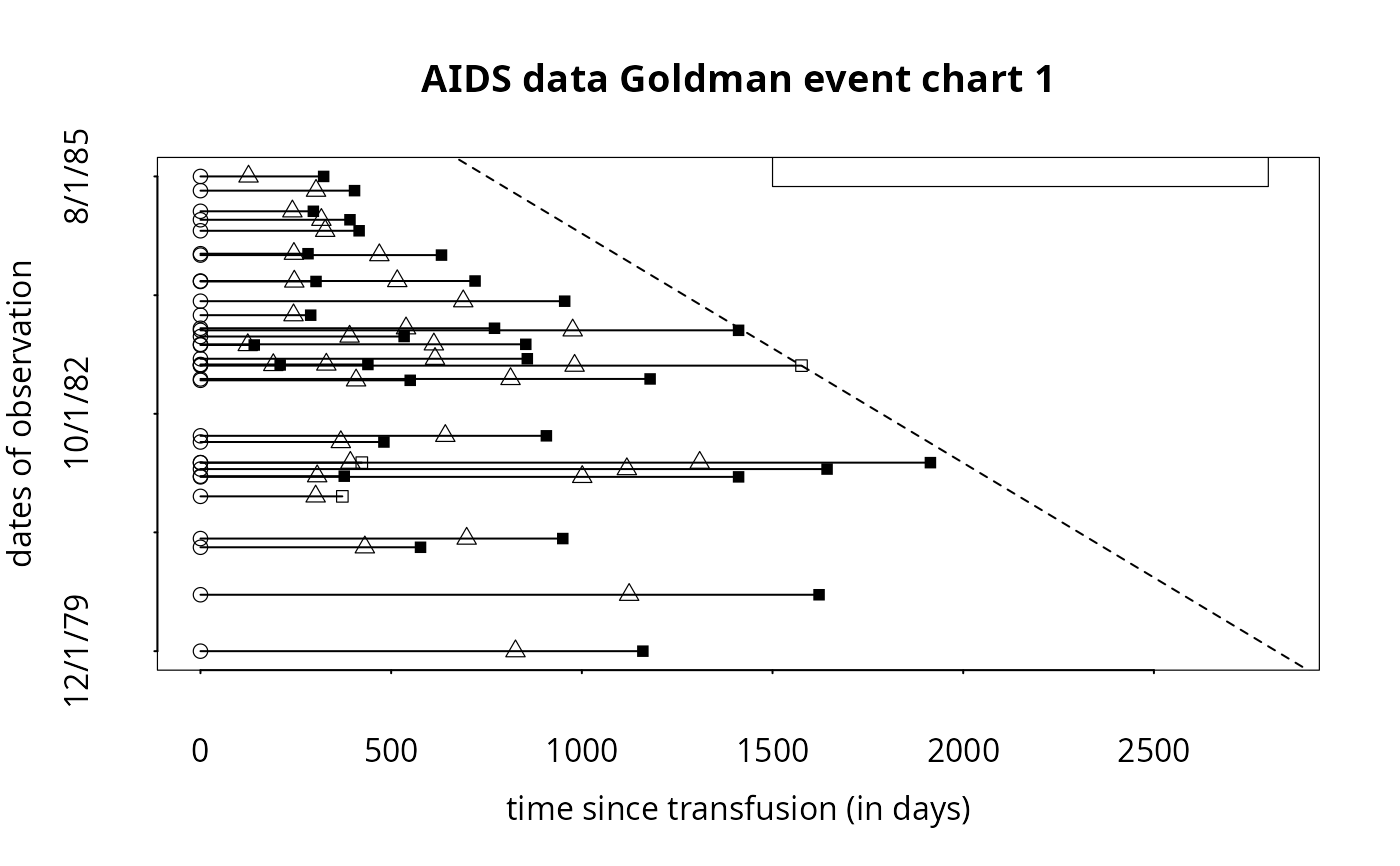
 # To produce the Goldman chart:
# postscript('example4.ps', horizontal=TRUE)
event.chart(cdcaids,
subset.c=c('infedate','diagdate','dethdate','censdate'),
x.lab = 'time since transfusion (in days)', y.lab='dates of observation',
titl='AIDS data Goldman event chart 1',
y.var = c('infedate'), y.var.type='d', now.line=TRUE, y.jitter=FALSE,
point.pch=c(1,2,15,0), point.cex=c(1,1,0.8,0.8), mgp = c(3.1,1.6,0),
legend.plot=TRUE, legend.location='i',legend.cex=1.0,
legend.point.text=c('transfusion','AIDS diagnosis','death','censored'),
x.reference='infedate', x.julian=TRUE,
legend.bty='o', legend.point.at = list(c(1500, 2800), c(9300, 10000)))
# To produce the Goldman chart:
# postscript('example4.ps', horizontal=TRUE)
event.chart(cdcaids,
subset.c=c('infedate','diagdate','dethdate','censdate'),
x.lab = 'time since transfusion (in days)', y.lab='dates of observation',
titl='AIDS data Goldman event chart 1',
y.var = c('infedate'), y.var.type='d', now.line=TRUE, y.jitter=FALSE,
point.pch=c(1,2,15,0), point.cex=c(1,1,0.8,0.8), mgp = c(3.1,1.6,0),
legend.plot=TRUE, legend.location='i',legend.cex=1.0,
legend.point.text=c('transfusion','AIDS diagnosis','death','censored'),
x.reference='infedate', x.julian=TRUE,
legend.bty='o', legend.point.at = list(c(1500, 2800), c(9300, 10000)))
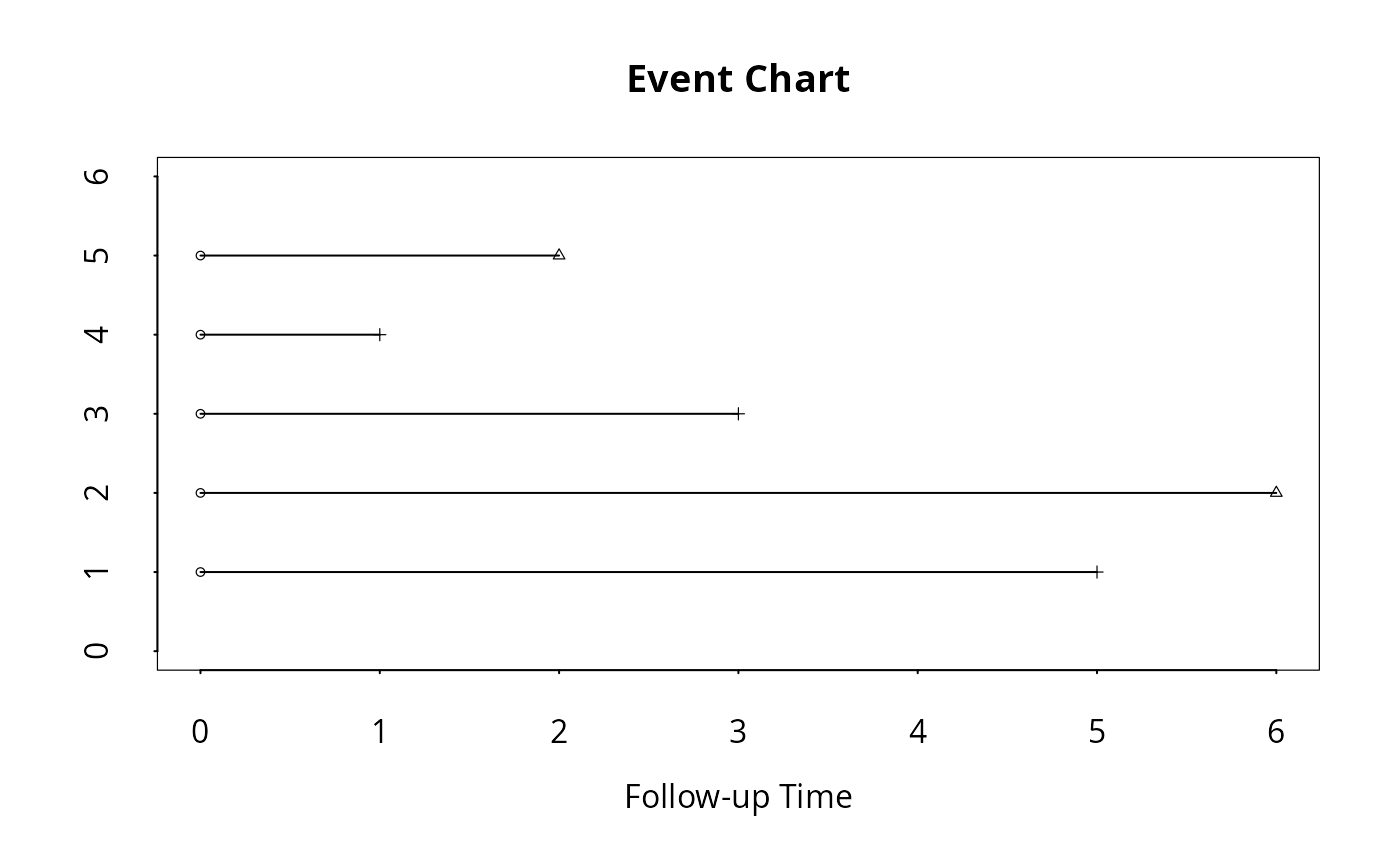
 # To convert coded time-to-event data, then, draw an event chart:
surv.time <- c(5,6,3,1,2)
cens.ind <- c(1,0,1,1,0)
surv.data <- cbind(surv.time,cens.ind)
event.data <- event.convert(surv.data)
event.chart(cbind(rep(0,5),event.data),x.julian=TRUE,x.reference=1)
# To convert coded time-to-event data, then, draw an event chart:
surv.time <- c(5,6,3,1,2)
cens.ind <- c(1,0,1,1,0)
surv.data <- cbind(surv.time,cens.ind)
event.data <- event.convert(surv.data)
event.chart(cbind(rep(0,5),event.data),x.julian=TRUE,x.reference=1)