Effects of Mandatory Seat Belt Laws in the US
USSeatBelts.RdBalanced panel data for the years 1983–1997 from 50 US States, plus the District of Columbia, for assessing traffic fatalities and seat belt usage.
Usage
data("USSeatBelts")Format
A data frame containing 765 observations on 12 variables.
- state
factor indicating US state (abbreviation).
- year
factor indicating year.
- miles
millions of traffic miles per year.
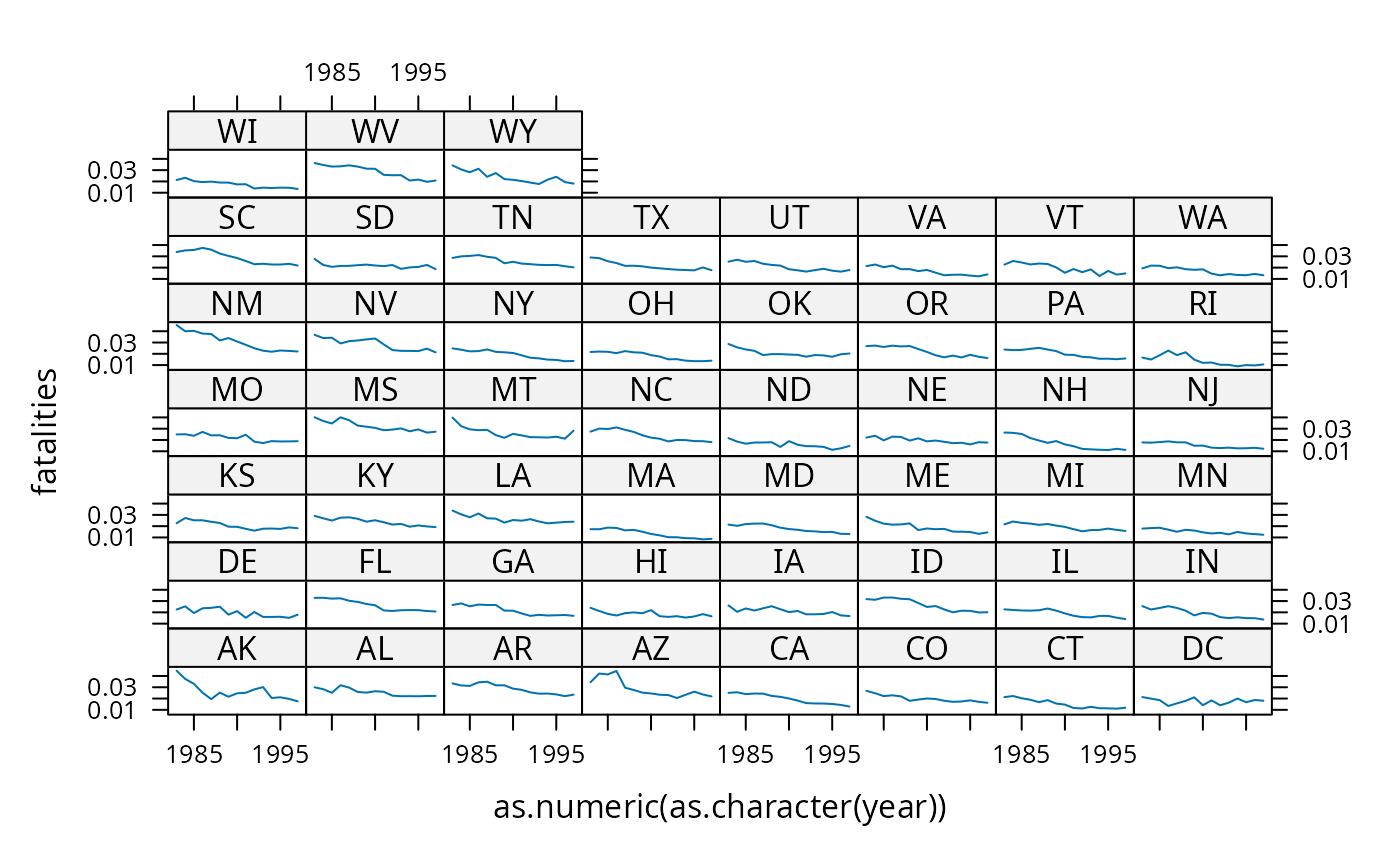
- fatalities
number of fatalities per million of traffic miles (absolute frequencies of fatalities =
fatalitiestimesmiles).- seatbelt
seat belt usage rate, as self-reported by state population surveyed.
- speed65
factor. Is there a 65 mile per hour speed limit?
- speed70
factor. Is there a 70 (or higher) mile per hour speed limit?
- drinkage
factor. Is there a minimum drinking age of 21 years?
- alcohol
factor. Is there a maximum of 0.08 blood alcohol content?
- income
median per capita income (in current US dollar).
- age
mean age.
- enforce
factor indicating seat belt law enforcement (
"no","primary","secondary").
References
Cohen, A., and Einav, L. (2003). The Effects of Mandatory Seat Belt Laws on Driving Behavior and Traffic Fatalities. The Review of Economics and Statistics, 85, 828–843
Stock, J.H. and Watson, M.W. (2007). Introduction to Econometrics, 2nd ed. Boston: Addison Wesley.
Examples
data("USSeatBelts")
summary(USSeatBelts)
#>      state          year         miles          fatalities
#>  AK     : 15   1983   : 51   Min.   :  3099   Min.   :0.008327
#>  AL     : 15   1984   : 51   1st Qu.: 11401   1st Qu.:0.017341
#>  AR     : 15   1985   : 51   Median : 30319   Median :0.021199
#>  AZ     : 15   1986   : 51   Mean   : 41448   Mean   :0.021490
#>  CA     : 15   1987   : 51   3rd Qu.: 52312   3rd Qu.:0.024774
#>  CO     : 15   1988   : 51   Max.   :285612   Max.   :0.045470
#>  (Other):675   (Other):459
#>     seatbelt      speed65   speed70   drinkage  alcohol       income
#>  Min.   :0.0600   no :271   no :711   no : 88   no :676   Min.   : 8372
#>  1st Qu.:0.4200   yes:494   yes: 54   yes:677   yes: 89   1st Qu.:14266
#>  Median :0.5500                                           Median :17624
#>  Mean   :0.5289                                           Mean   :17993
#>  3rd Qu.:0.6500                                           3rd Qu.:21080
#>  Max.   :0.8700                                           Max.   :35863
#>  NA's   :209
#>       age             enforce
#>  Min.   :28.23   no       :293
#>  1st Qu.:34.39   primary  : 93
#>  Median :35.39   secondary:379
#>  Mean   :35.14
#>  3rd Qu.:36.13
#>  Max.   :39.17
#>

library("lattice")
xyplot(fatalities ~ as.numeric(as.character(year)) | state, data = USSeatBelts, type = "l")