Plotting zoo Objects with tinyplot
tinyplot.zoo.RdThe approach is similar to that in autoplot.zoo
(based on ggplot2) and uses fortify.zoo (with melt = TRUE)
to convert the zoo object into a data frame and then uses a suitable
formula to visiualize the series.
Usage
# S3 method for class 'zoo'
tinyplot(object, facet, type = "l",
facet.args = list(free = TRUE), ylab = "", ...)Arguments
- object
an object of class
"zoo".- facet
specification of
facetfortinyplot.formula. The default in thetinyplotmethod is to usefacet = NULLfor univariate series andfacet = ~ Seriesfor multivariate series.- type, facet.args, ylab, ...
further arguments passed to
tinyplot.
Examples
if(require("tinyplot")) {
suppressWarnings(RNGversion("3.5.0"))
set.seed(1)
## example data
x.Date <- as.Date(paste(2003, 02, c(1, 3, 7, 9, 14), sep = "-"))
x <- zoo(rnorm(5), x.Date)
xlow <- x - runif(5)
xhigh <- x + runif(5)
z <- cbind(x, xlow, xhigh)
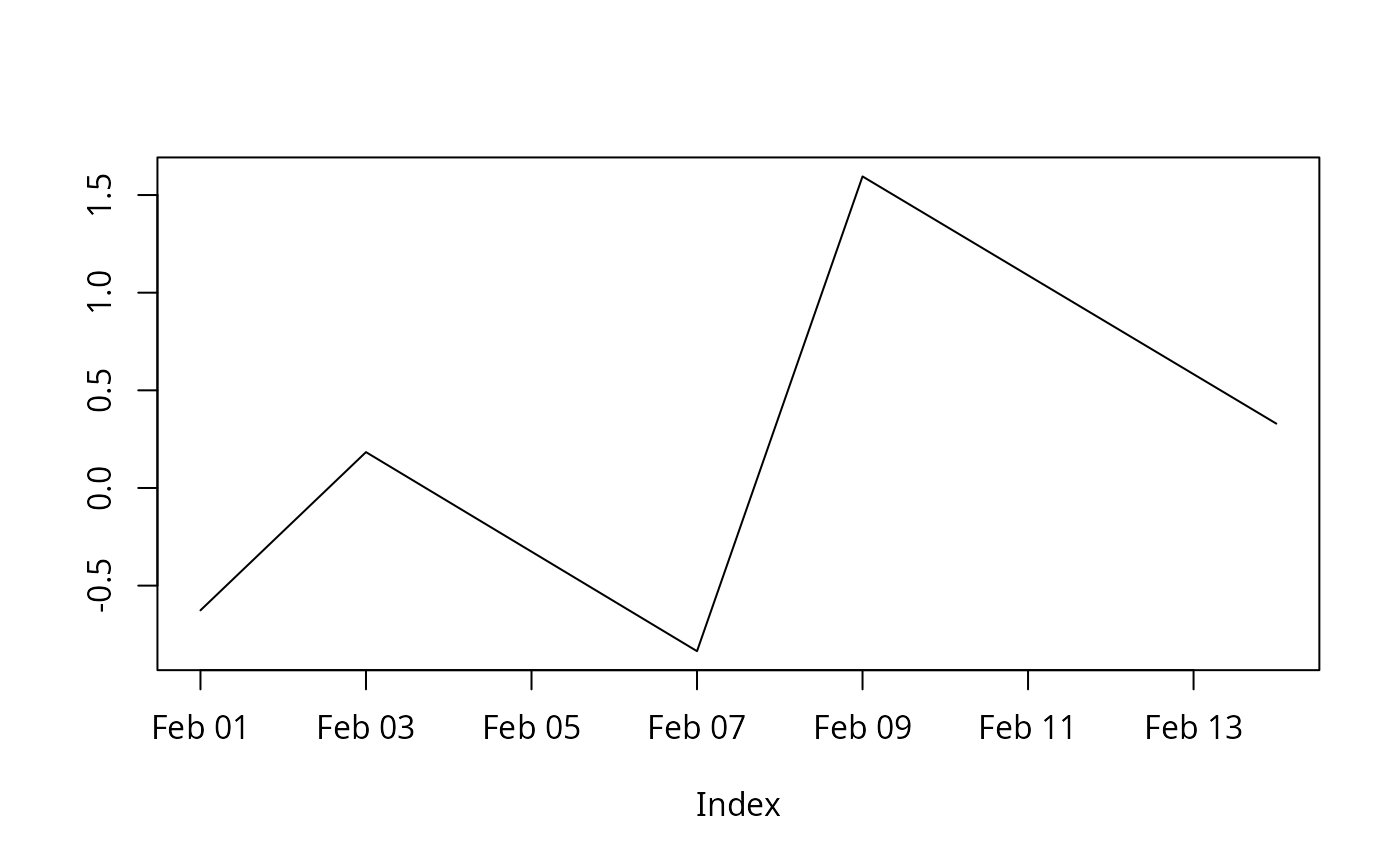
## univariate plotting
tinyplot(x)
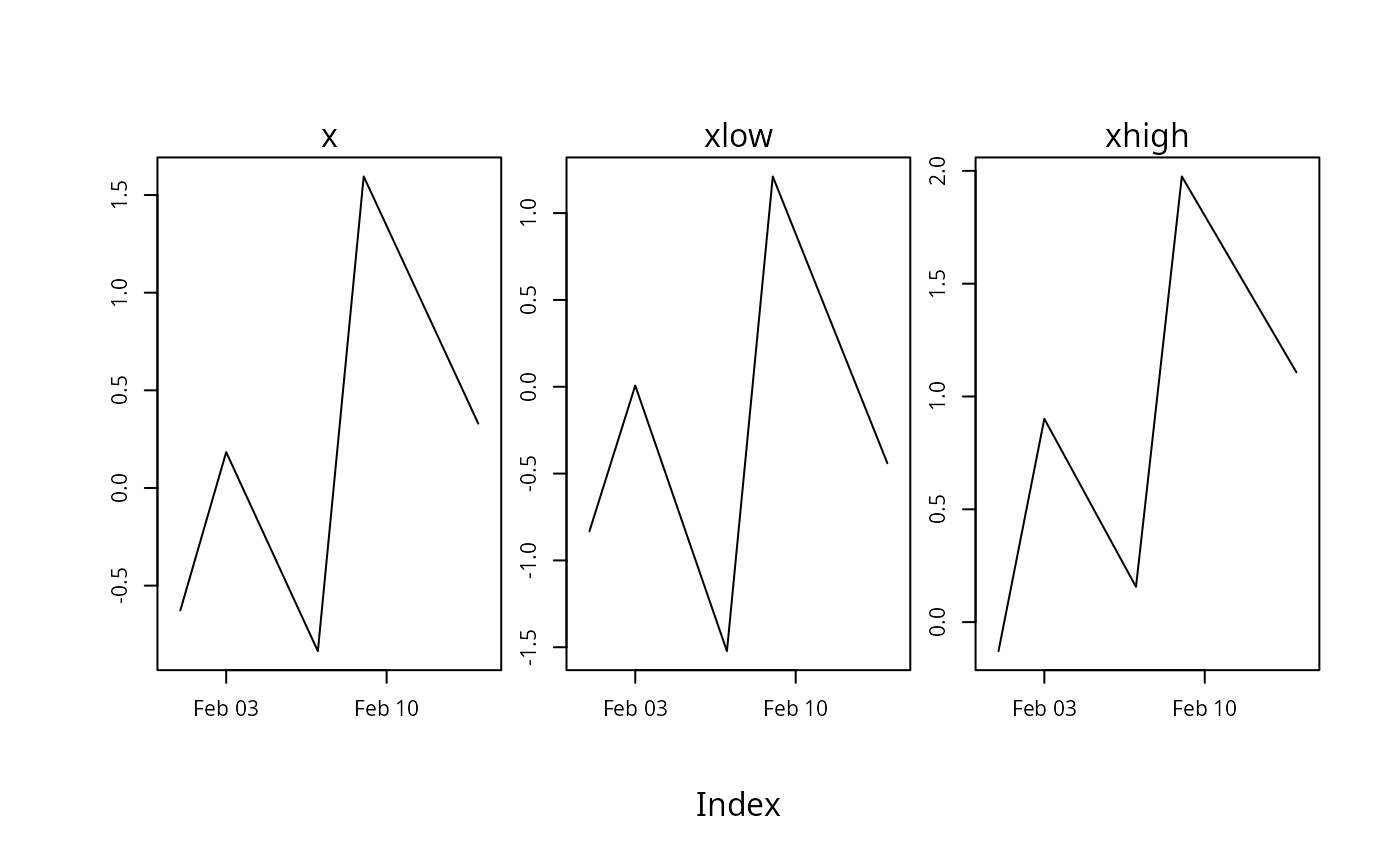
## multivariate plotting in multiple or single panels
tinyplot(z) ## multiple without color/linetype with free scales
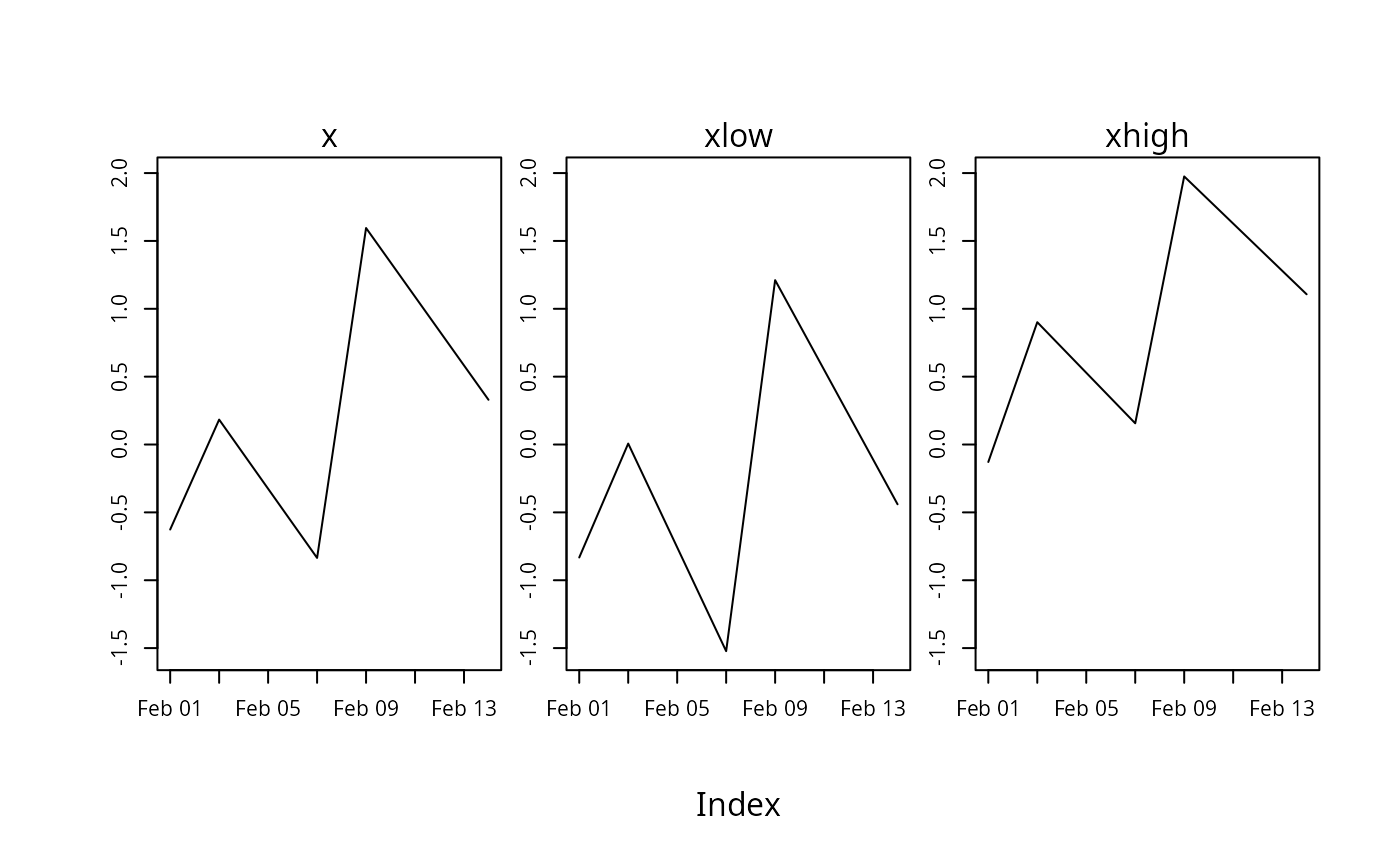
tinyplot(z, facet.args = NULL) ## multiple without color/linetype with same scale
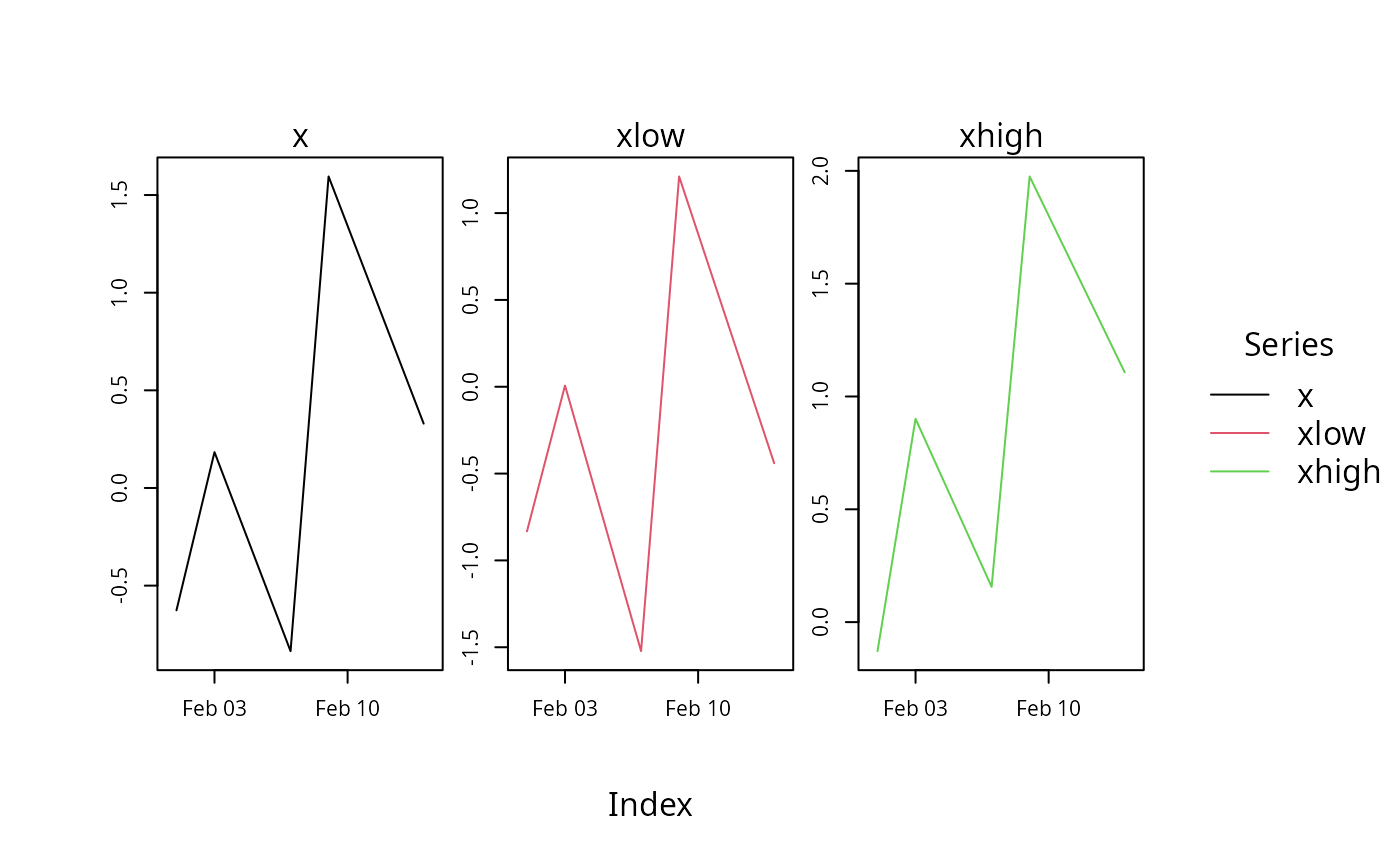
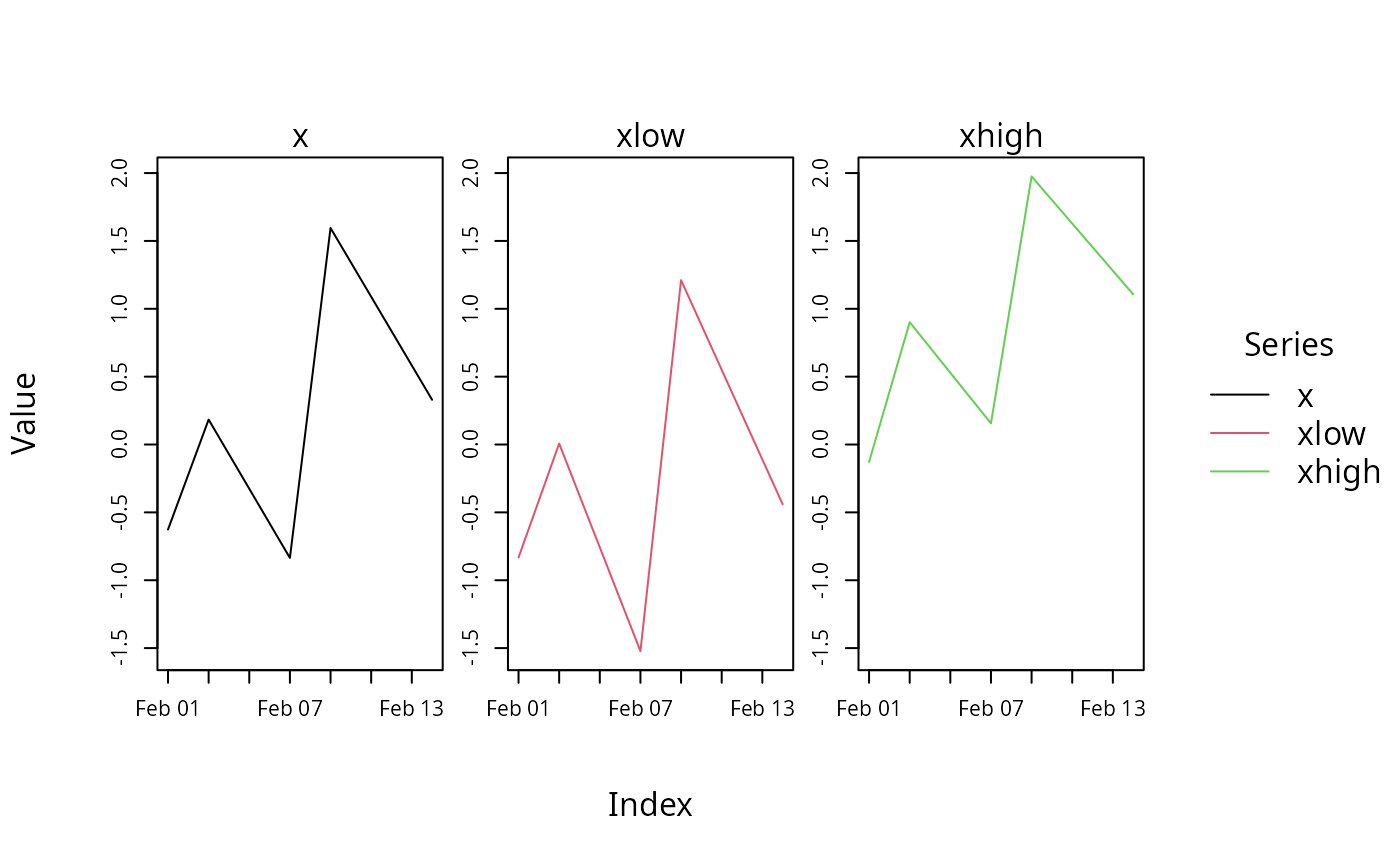
tinyplot(z, facet = ~ Series) ## multiple with series-dependent color/linetype
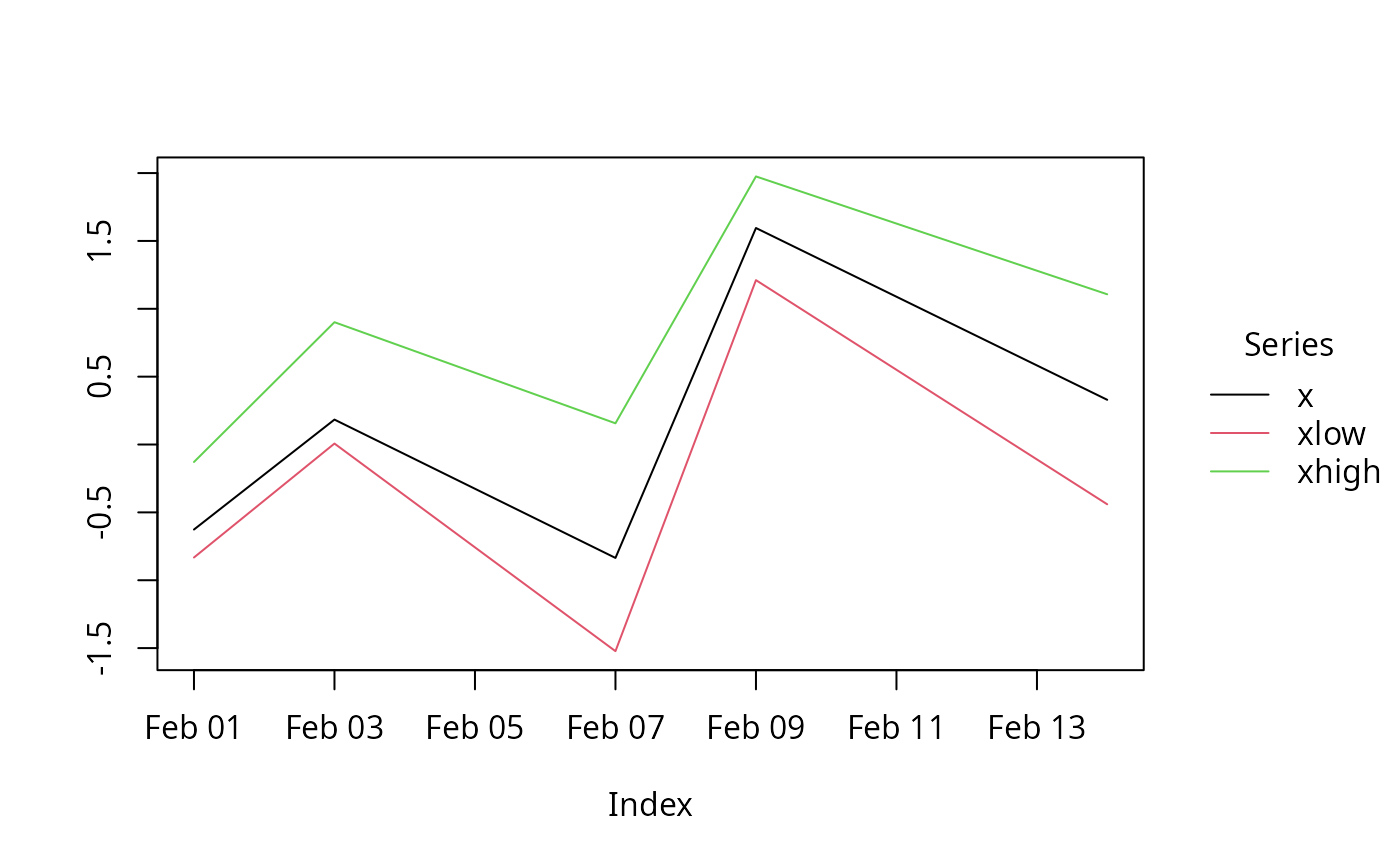
tinyplot(z, facet = NULL) ## single with series-dependent color/linetype
## by hand with color/linetype and with/without facets
d <- fortify.zoo(z, melt = TRUE)
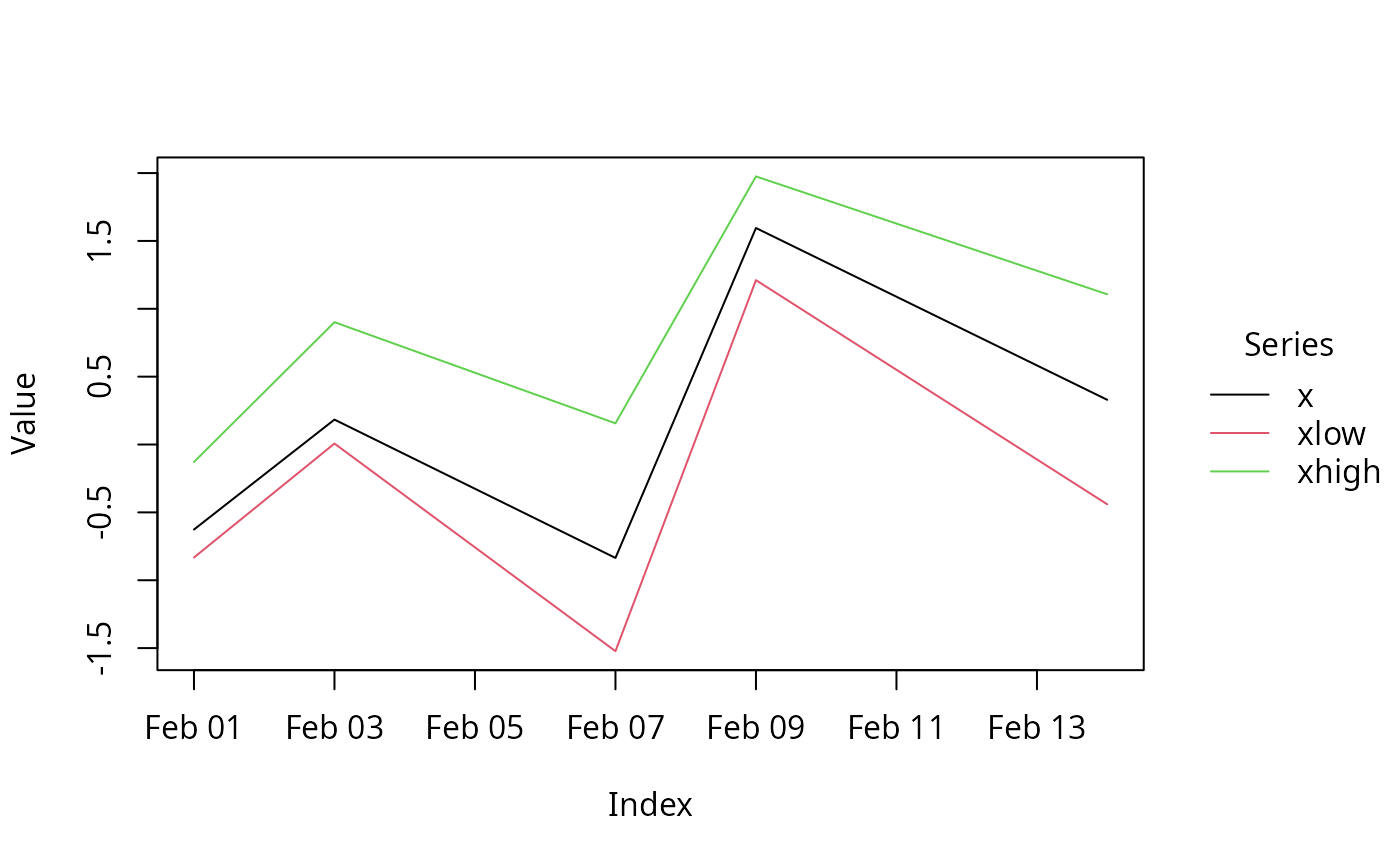
tinyplot(Value ~ Index | Series, data = d, type = "l")
tinyplot(Value ~ Index | Series, facet = "by", data = d, type = "l")
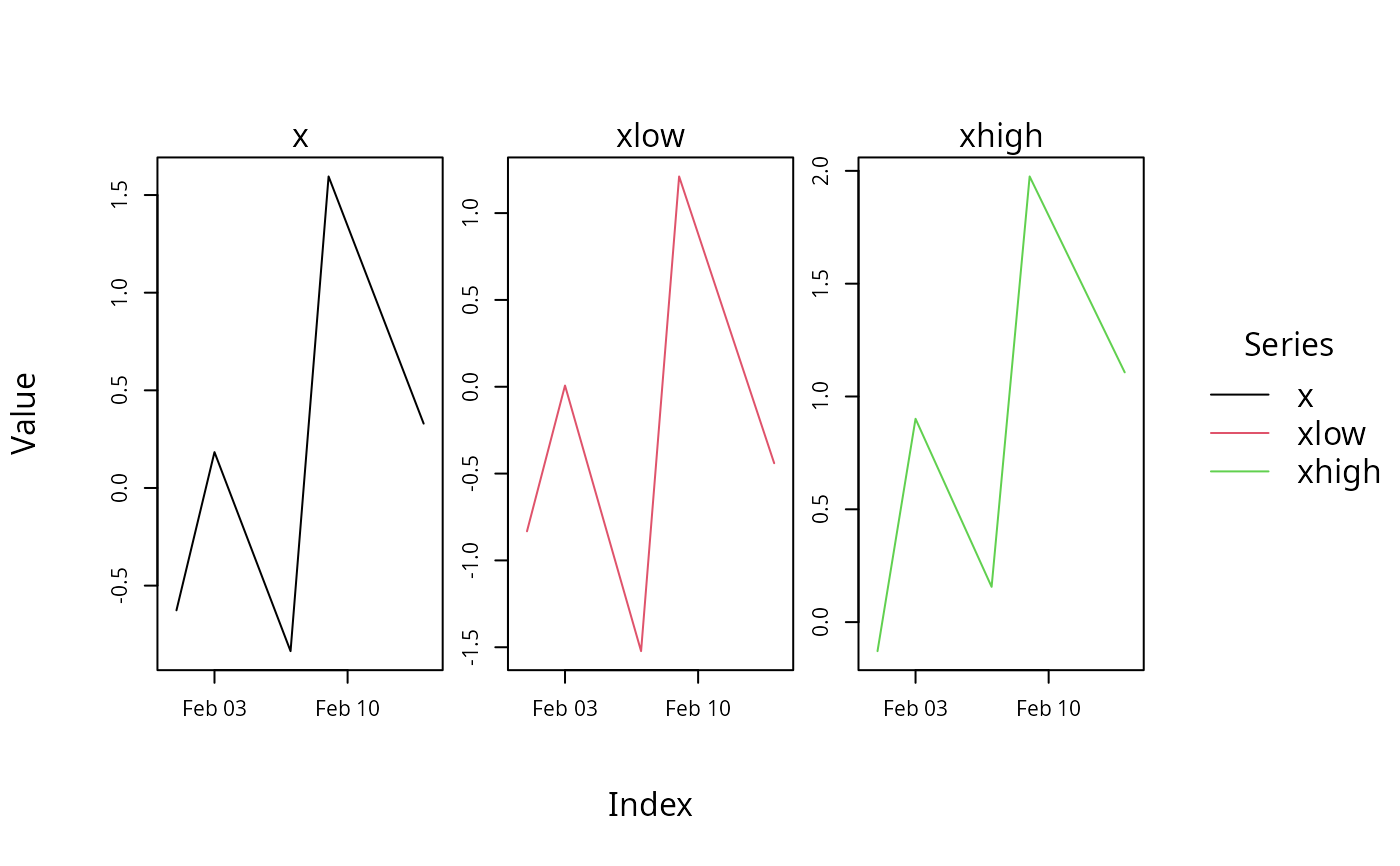
tinyplot(Value ~ Index | Series, facet = "by", data = d, type = "l", facet.args = list(free = TRUE))
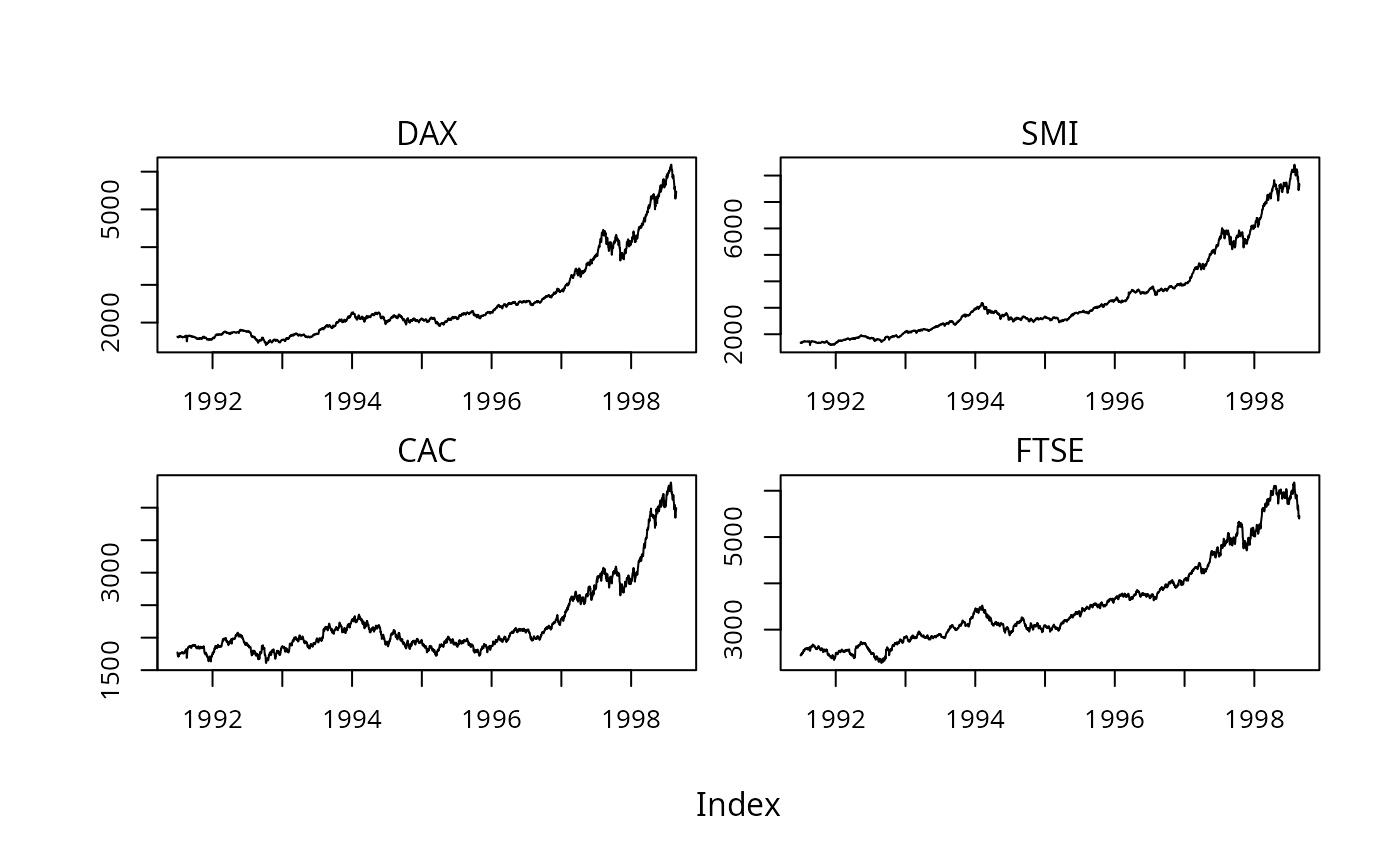
## EuStockMarkets data (coerced from "ts")
eusm <- as.zoo(EuStockMarkets)
tinyplot(eusm)
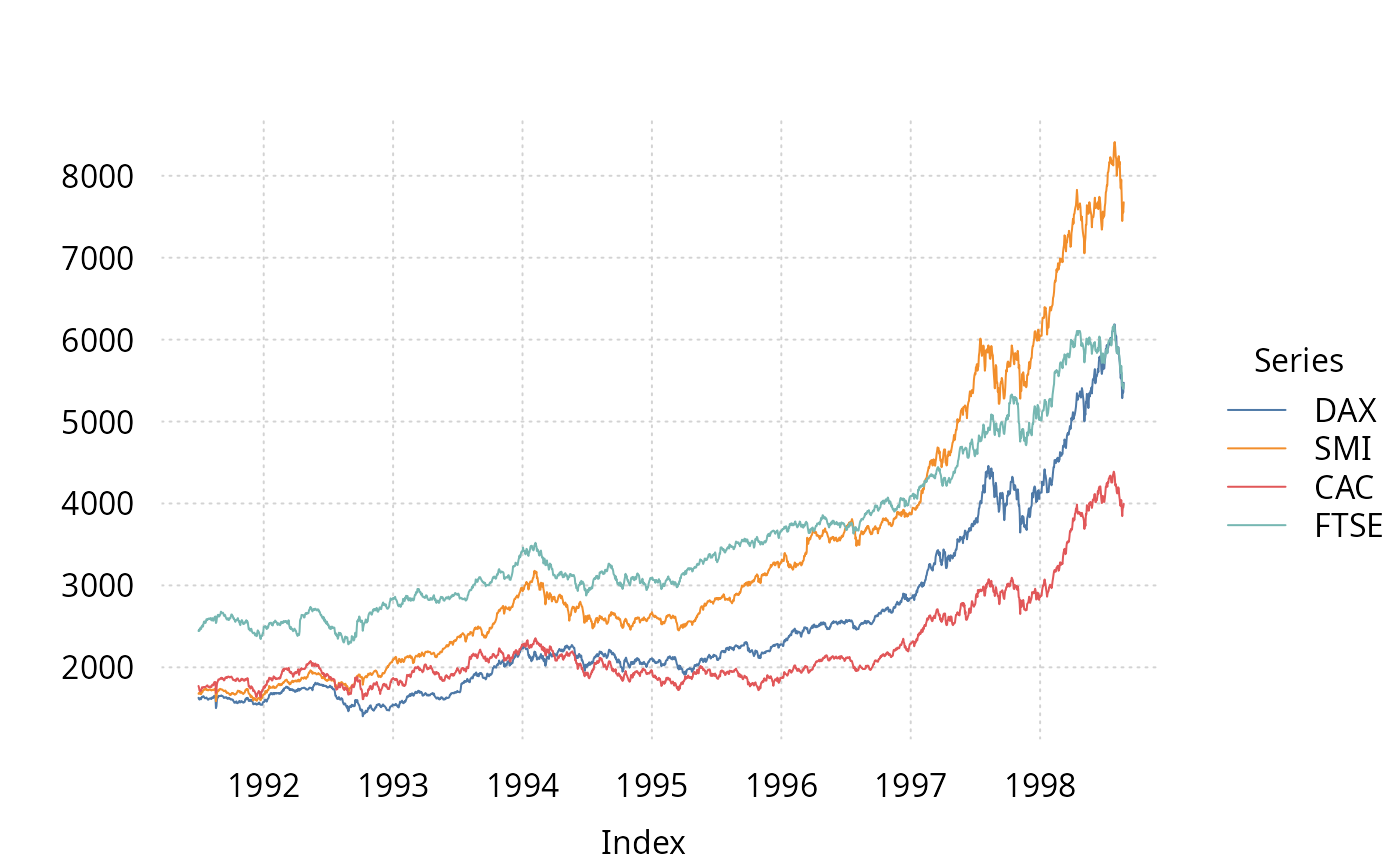
tinytheme("clean2")
tinyplot(eusm, facet = NULL)
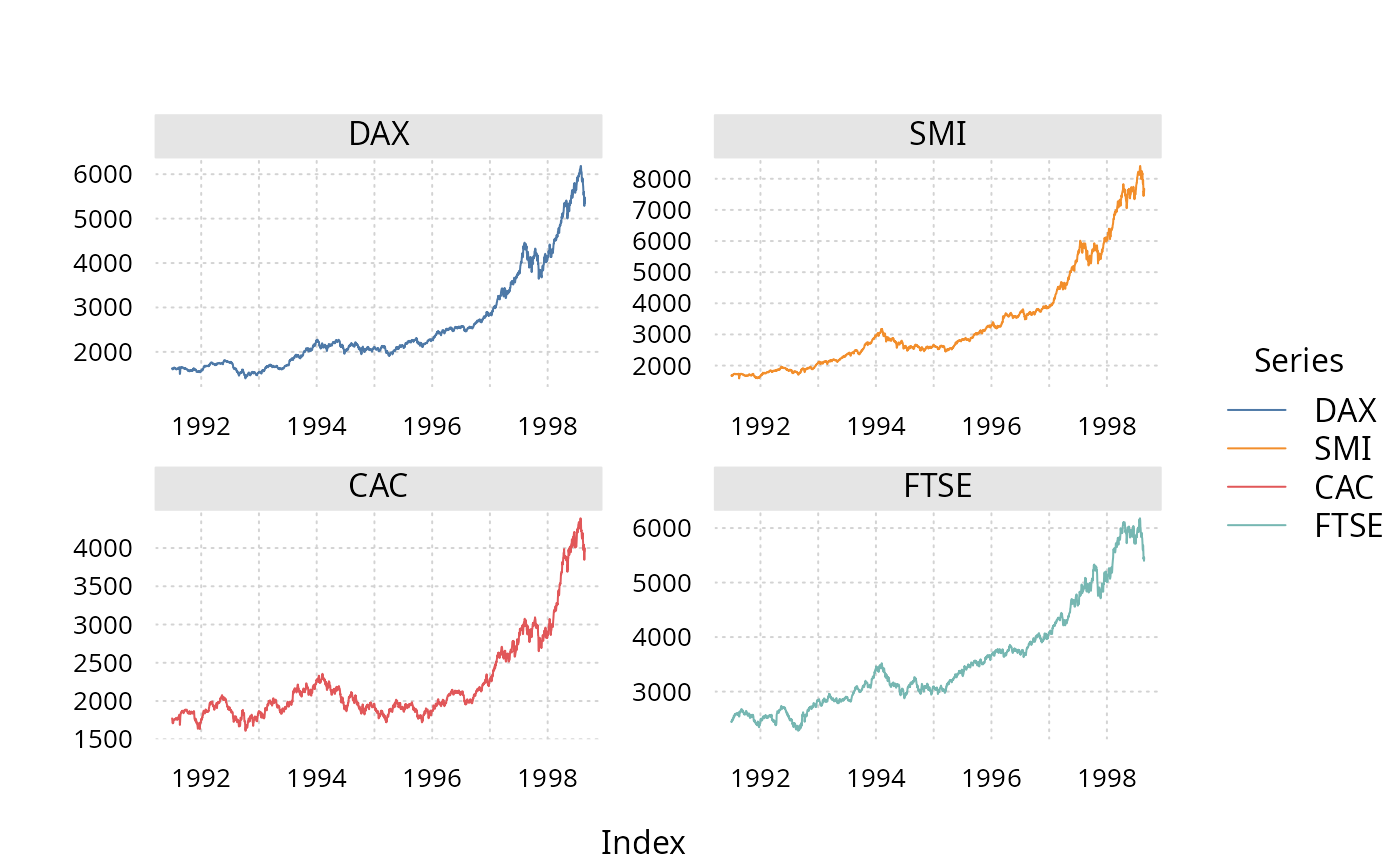
tinyplot(eusm, facet = ~ Series)
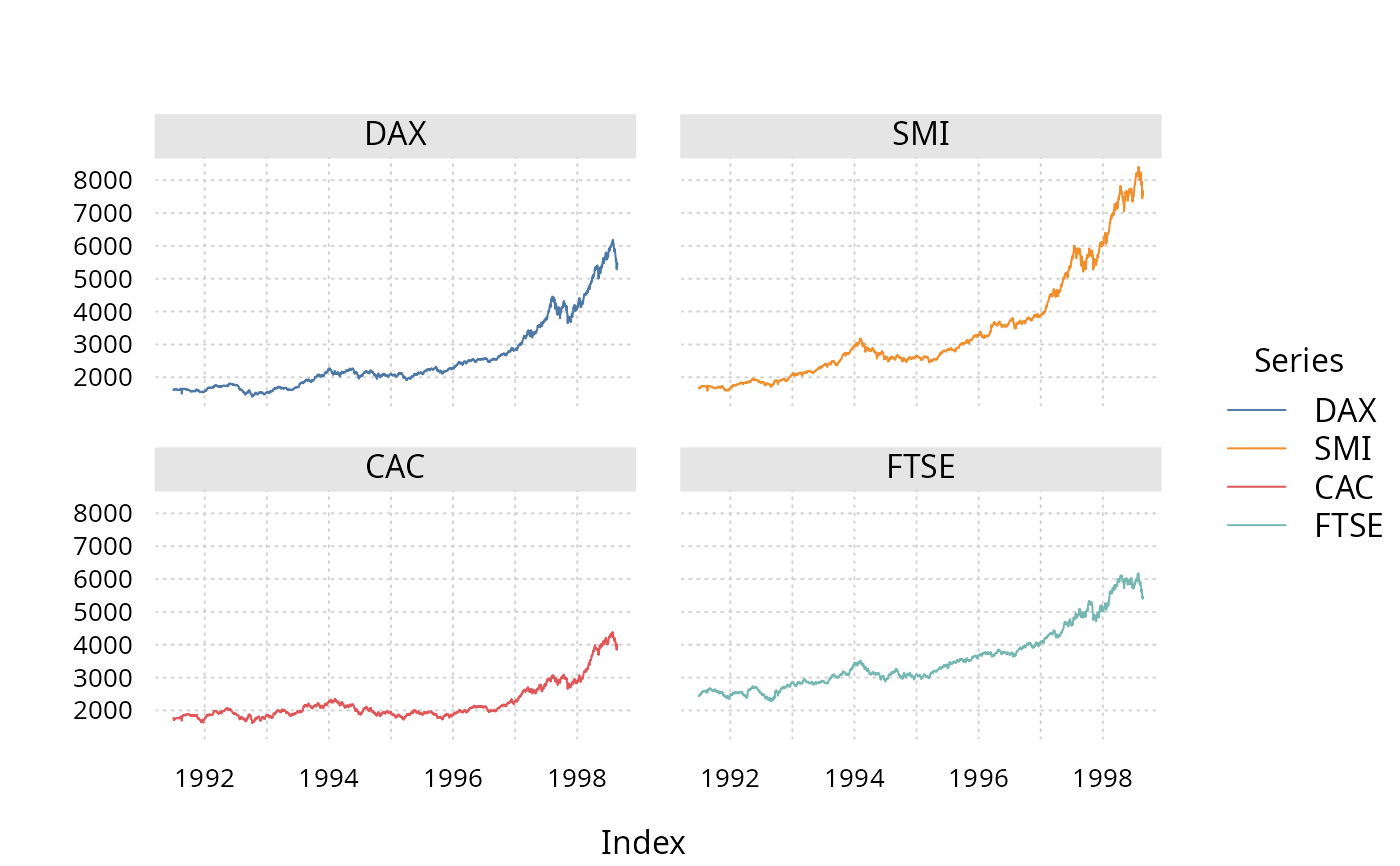
tinyplot(eusm, facet = ~ Series, facet.args = NULL)
tinytheme() ## reset
}
#> Loading required package: tinyplot