Apply a function to the data of an existing xts plot object and plot the
result on an existing or new panel. FUN should have arguments x or R
for the data of the existing xts plot object to be passed to. All other
additional arguments for FUN are passed through ....
Arguments
- FUN
An xts object to plot.
- main
Main title for a new panel if drawn.
- on
Panel number to draw on. A new panel will be drawn if
on = NA.- type
The type of plot to be drawn, same as in
plot().- col
Color palette to use, set by default to rational choices.
- lty
Set the line type, same as in
par().- lwd
Set the line width, same as in
par().- pch
The type of plot to be drawn, same as in
par().- ...
Additional named arguments passed through to
FUNand any other graphical passthrough parameters.
Examples
library(xts)
data(sample_matrix)
sample.xts <- as.xts(sample_matrix)
calcReturns <- function(price, method = c("discrete", "log")){
px <- try.xts(price)
method <- match.arg(method)[1L]
returns <- switch(method,
simple = ,
discrete = px / lag(px) - 1,
compound = ,
log = diff(log(px)))
reclass(returns, px)
}
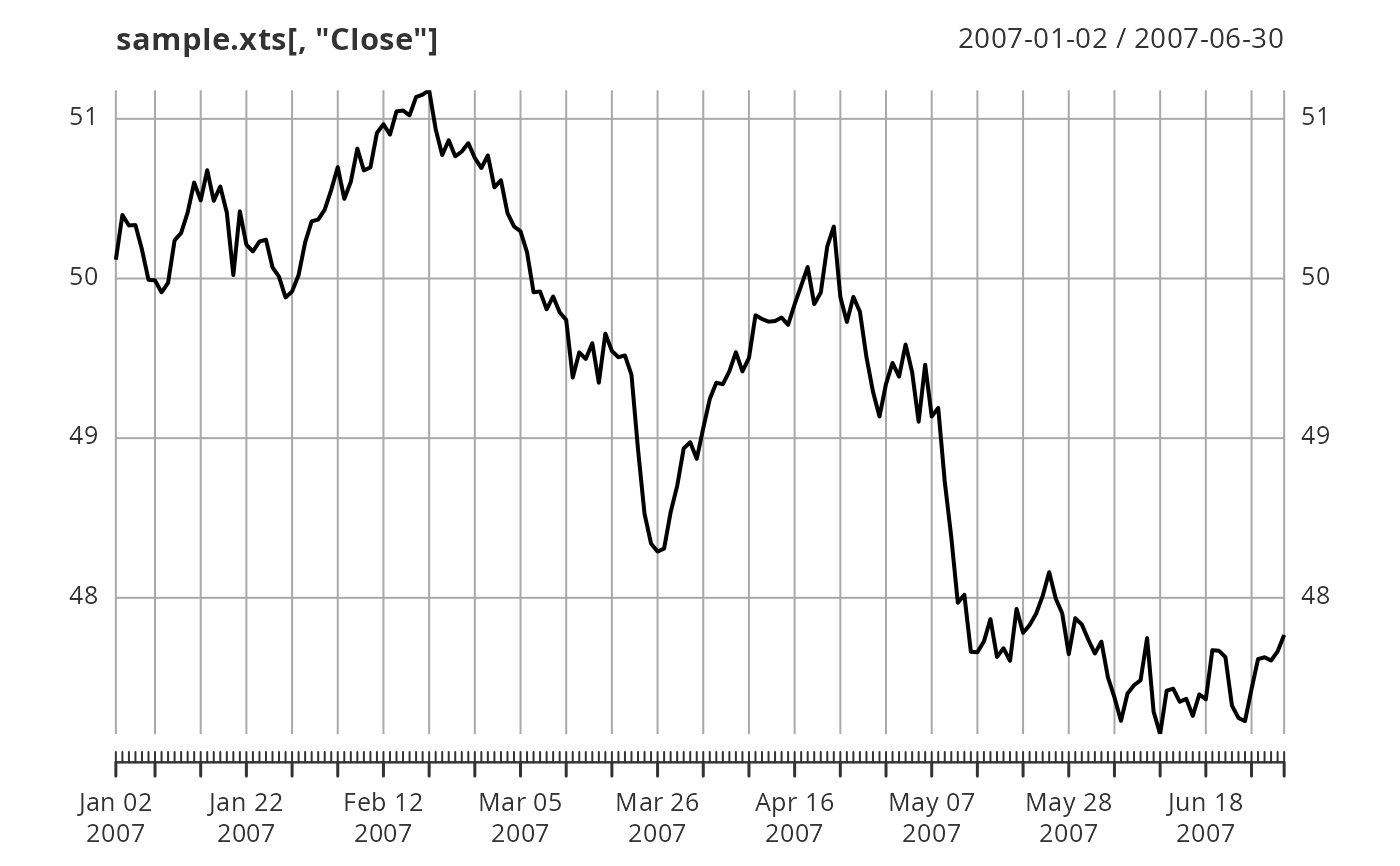
# plot the Close
plot(sample.xts[,"Close"])
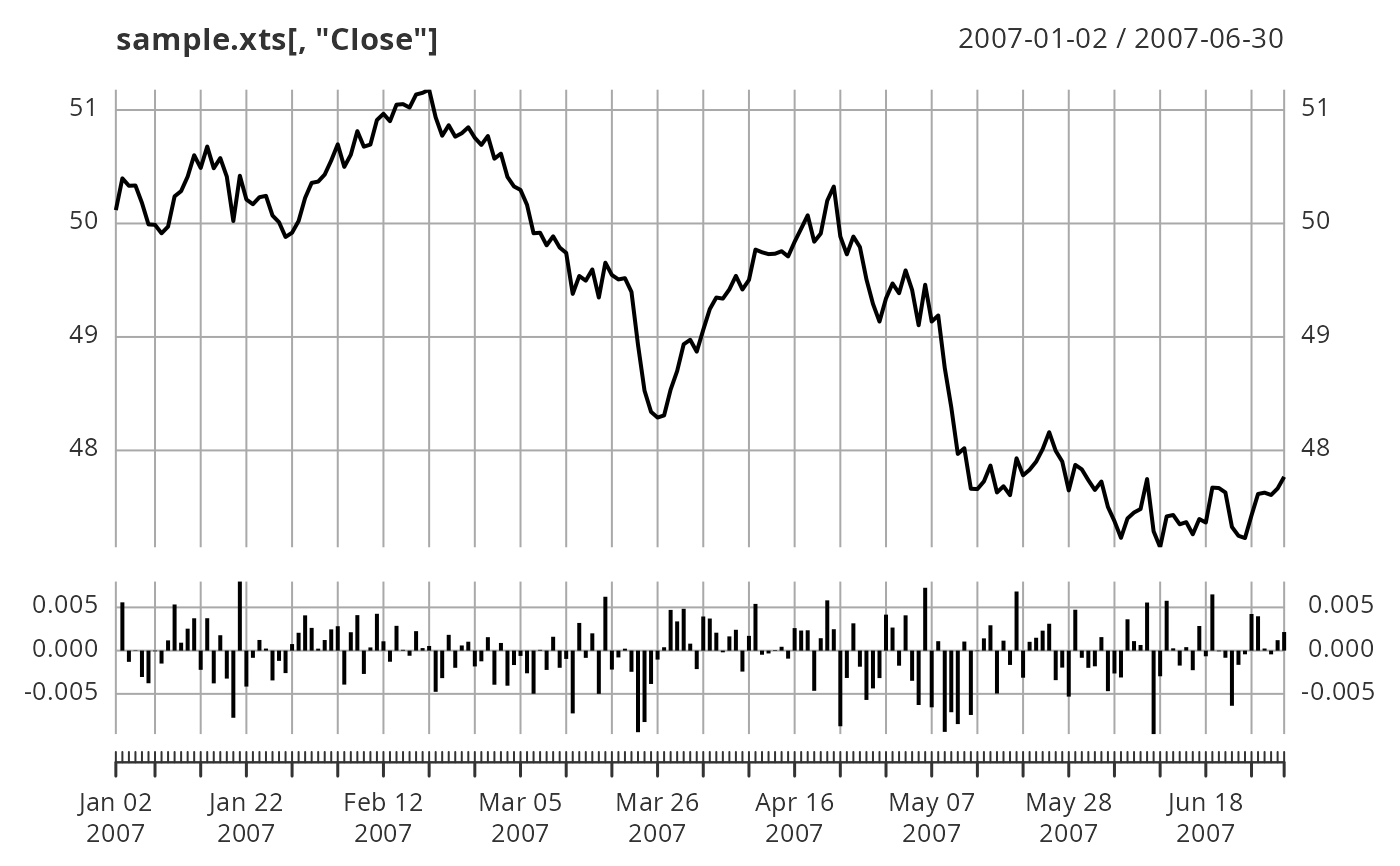
 # calculate returns
addPanel(calcReturns, method = "discrete", type = "h")
# calculate returns
addPanel(calcReturns, method = "discrete", type = "h")
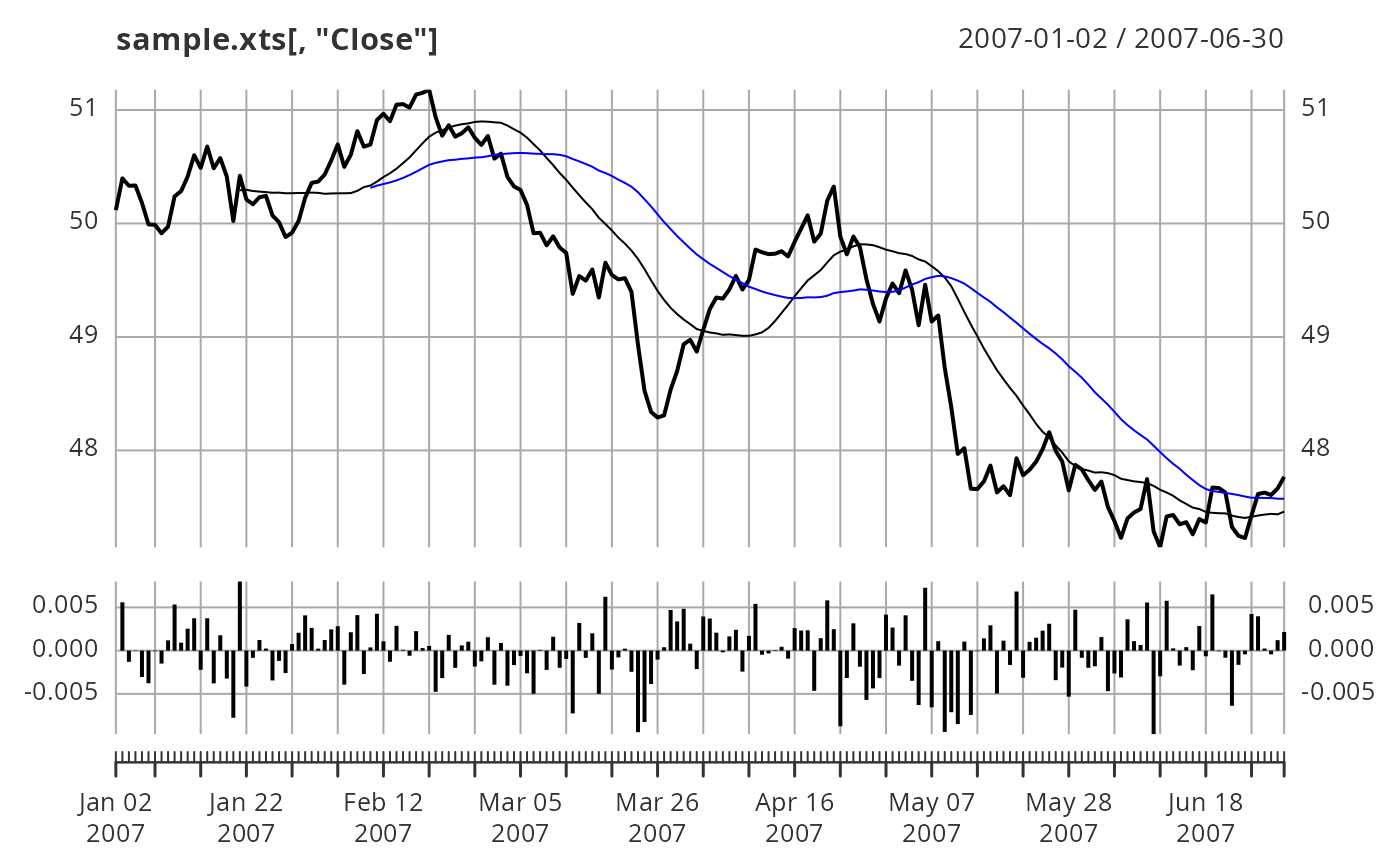
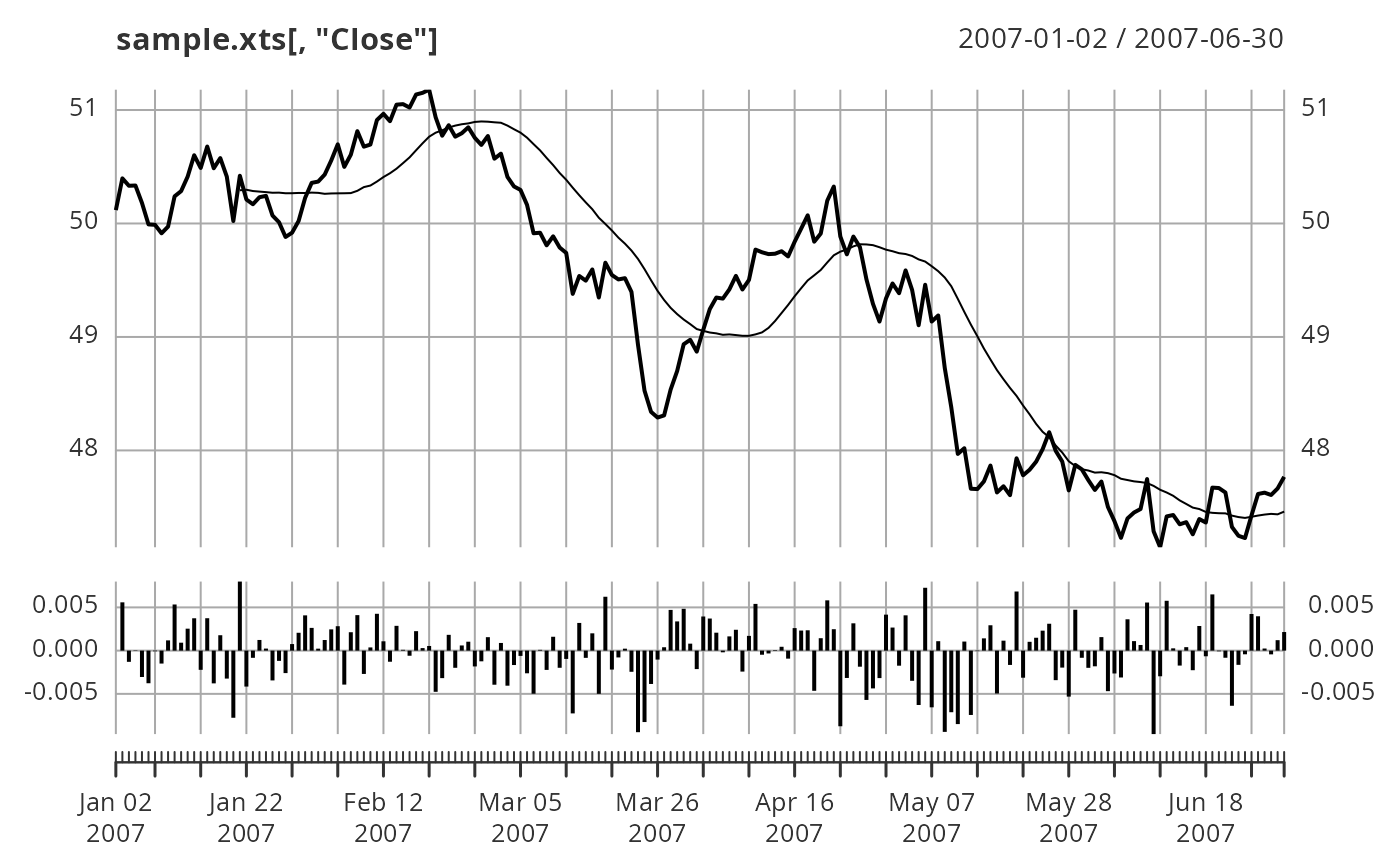
 # Add simple moving average to panel 1
addPanel(rollmean, k = 20, on = 1)
# Add simple moving average to panel 1
addPanel(rollmean, k = 20, on = 1)
 addPanel(rollmean, k = 40, col = "blue", on = 1)