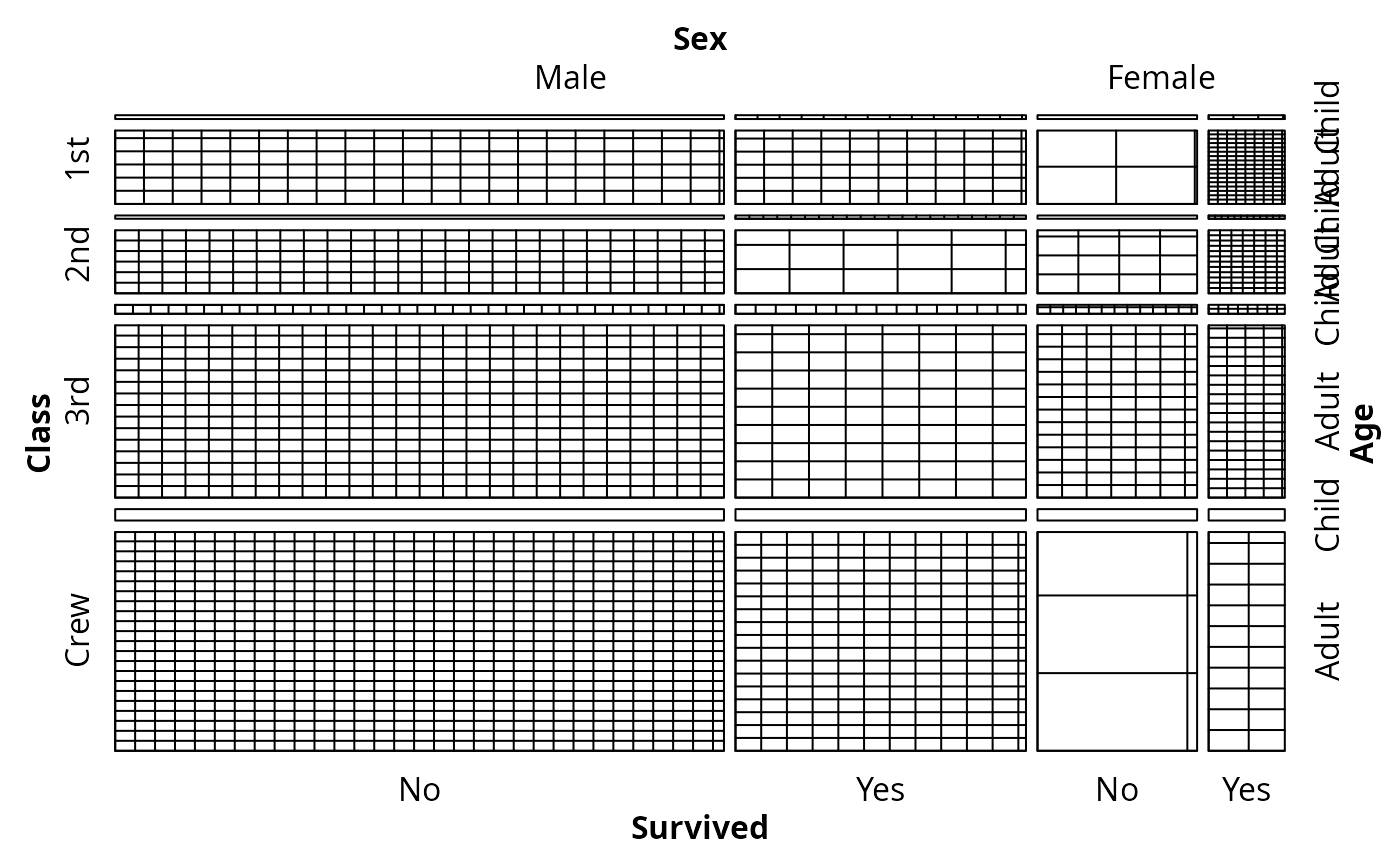
Core-generating Function for Sieve Plots
struc_sieve.RdCore-generating function for strucplot returning a function
producing sieve plots.
struc_sieve(sievetype = c("observed","expected"), gp_tile = gpar(),
scale = 1)
Arguments
Details
This function is usually called by strucplot (typically
when called by sieve) and returns a function used by
strucplot to produce sieve plots.
Value
A function with arguments:
- residuals
table of residuals.
- observed
table of observed values.
- expected
not used by
struc_sieve.- spacing
object of class
"unit"specifying the space between the tiles.- gp
list of
gparobjects used for the drawing the tiles.- split_vertical
vector of logicals indicating, for each dimension of the table, the split direction.
See also
References
Riedwyl, H., and Schüpbach, M. (1994), Parquet diagram to plot contingency tables. In F. Faulbaum (ed.), Softstat '93: Advances in Statistical Software, 293–299. Gustav Fischer, New York.
Friendly, M. (2000), Visualizing Categorical Data, SAS Institute, Cary, NC.
Meyer, D., Zeileis, A., and Hornik, K. (2006),
The strucplot framework: Visualizing multi-way contingency tables with
vcd.
Journal of Statistical Software, 17(3), 1-48.
doi:10.18637/jss.v017.i03
and available as
vignette("strucplot").