Spacing-generating Functions
spacings.RdThese functions generate spacing functions to be used with
strucplot to obtain customized spaces between the
elements of a strucplot.
spacing_equal(sp = unit(0.3, "lines"))
spacing_dimequal(sp)
spacing_increase(start = unit(0.3, "lines"), rate = 1.5)
spacing_conditional(sp = unit(0.3, "lines"), start = unit(2, "lines"), rate = 1.8)
spacing_highlighting(start = unit(0.2, "lines"), rate = 1.5)
Arguments
Details
These generating functions return a function used by
strucplot to generate appropriate spaces between tiles of
a strucplot, using the dimnames information of the visualized
table.
spacing_equal allows to specify one fixed space for all
dimensions.
spacing_dimequal allows to specify a fixed space for
each dimension.
spacing_increase creates increasing spaces for all dimensions,
based on a starting value and an increase rate.
spacing_conditional combines spacing_equal and
spacing_increase to create fixed spaces for conditioned
dimensions, and increasing spaces for conditioning dimensions.
spacing_highlighting is essentially spacing_conditional but with
the space of the last dimension set to 0. With a corresponding color
scheme, this gives the impression of the last class being
‘highlighted’ in the penultimate class (as, e.g., in
doubledecker plots).
Value
A spacing function with arguments:
- d
"dim"attribute of a contingency table.- condvars
index vector of conditioning dimensions (currently only used by
spacing_conditional).
This function computes a list of objects of class "unit".
Each list element contains the spacing information for the
corresponding dimension of the table. The length of the
"unit" objects is \(k-1\), \(k\) number of levels of the
corresponding factor.
References
Meyer, D., Zeileis, A., and Hornik, K. (2006),
The strucplot framework: Visualizing multi-way contingency tables with
vcd.
Journal of Statistical Software, 17(3), 1-48.
doi:10.18637/jss.v017.i03
and available as
vignette("strucplot").
See also
Examples
data("Titanic")
strucplot(Titanic, spacing = spacing_increase(start = 0.5, rate = 1.5))
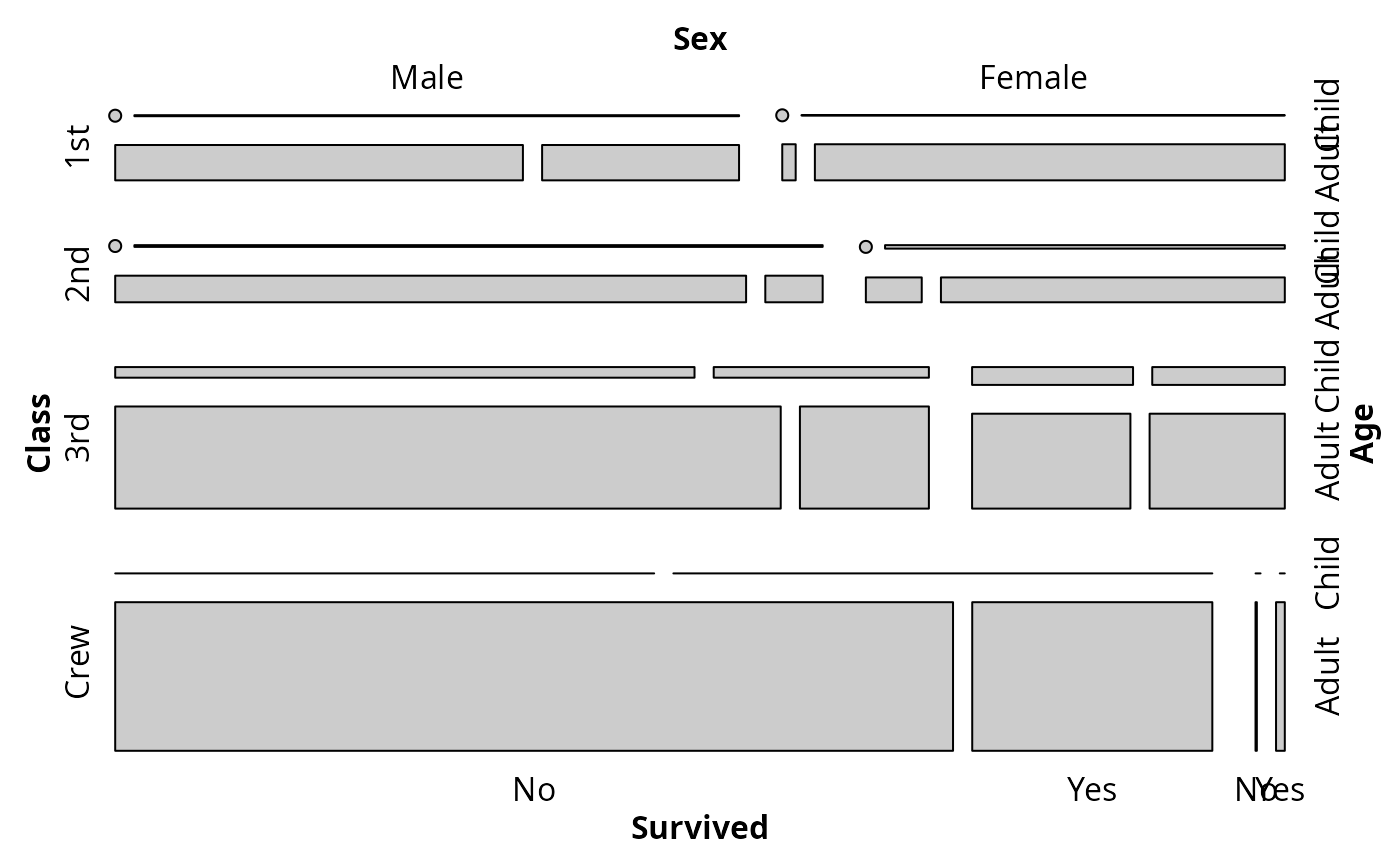 strucplot(Titanic, spacing = spacing_equal(1))
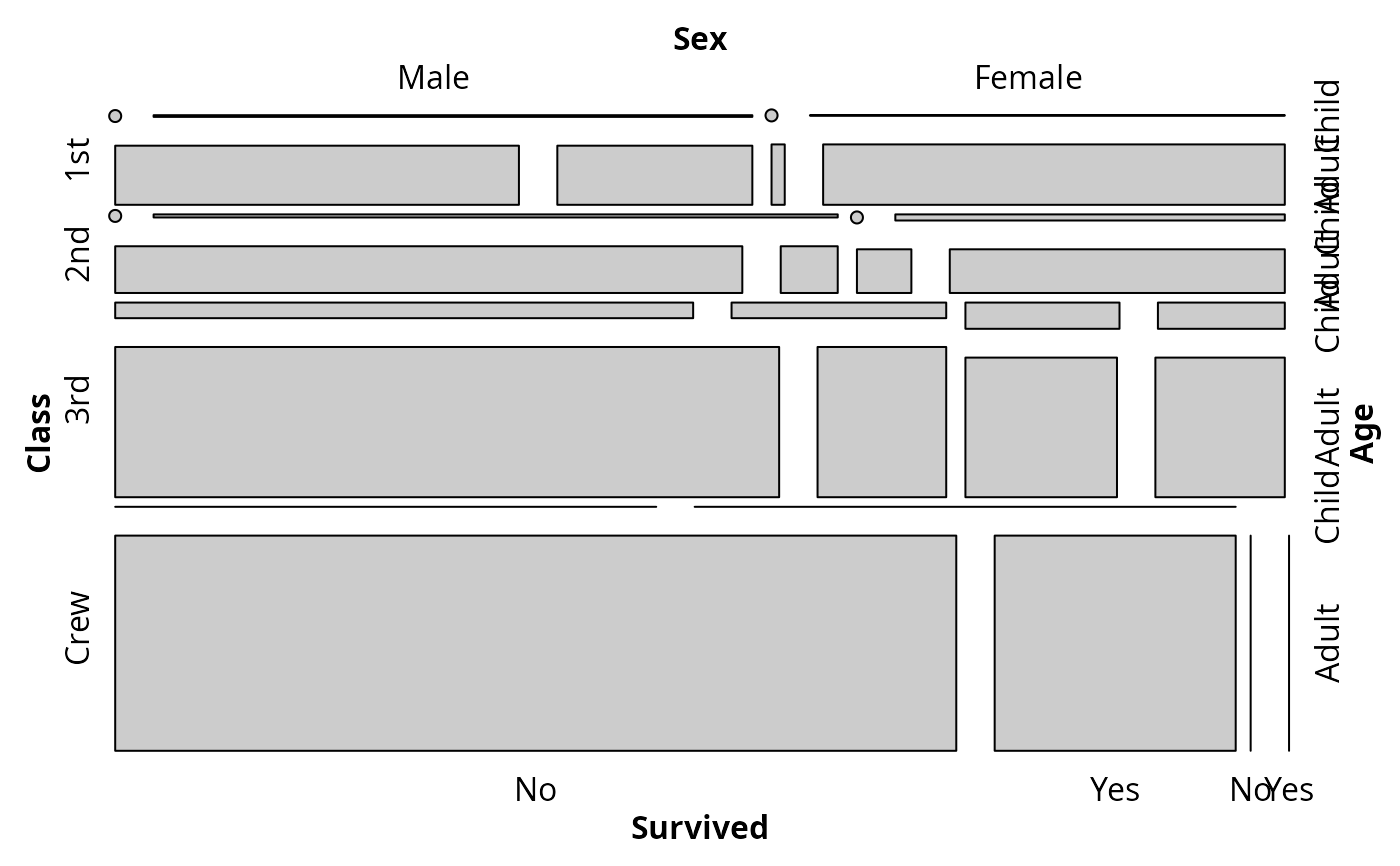
 strucplot(Titanic, spacing = spacing_dimequal(1:4 / 4))
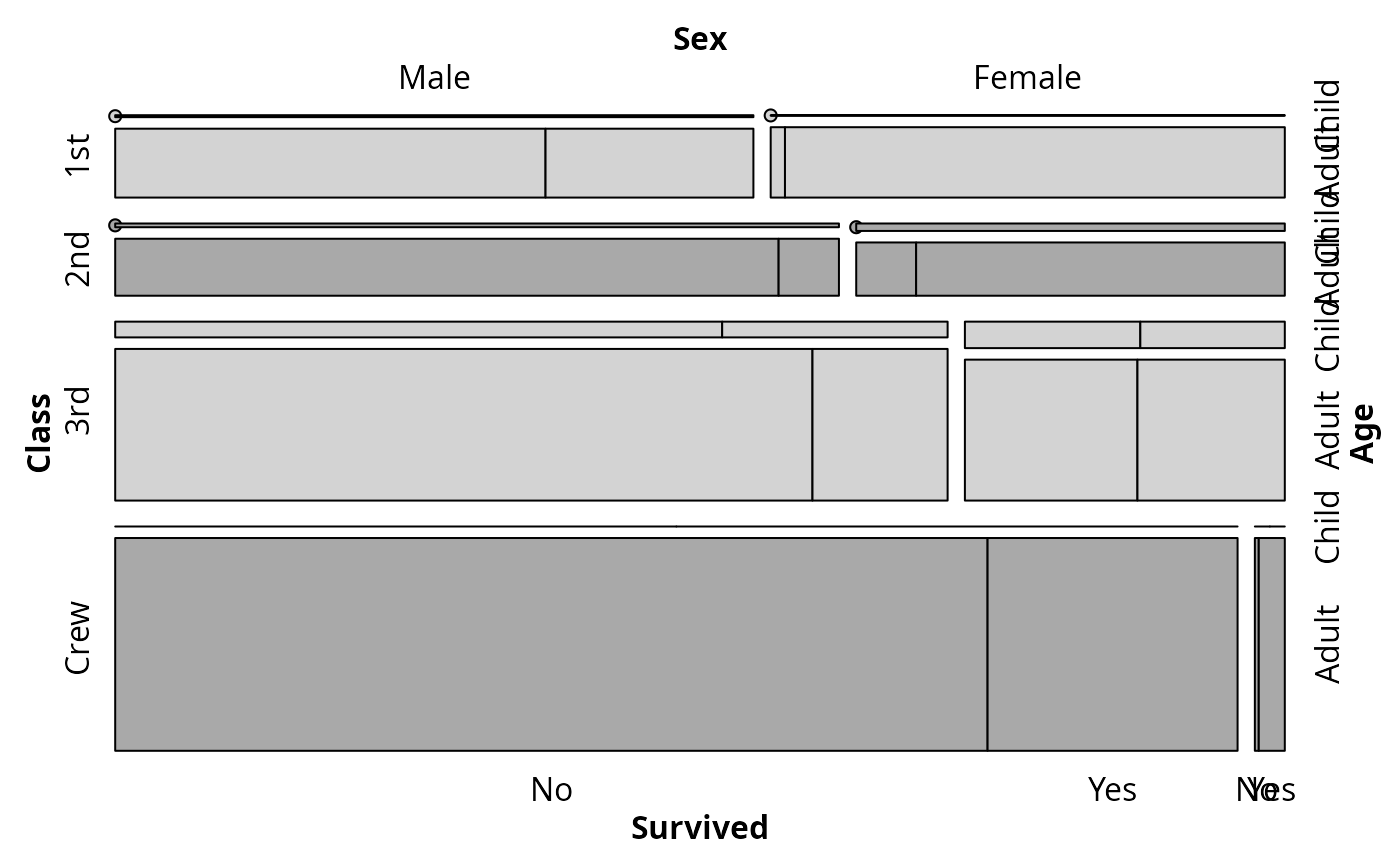
 strucplot(Titanic, spacing = spacing_highlighting,
gp = gpar(fill = c("light gray","dark gray")))
strucplot(Titanic, spacing = spacing_highlighting,
gp = gpar(fill = c("light gray","dark gray")))
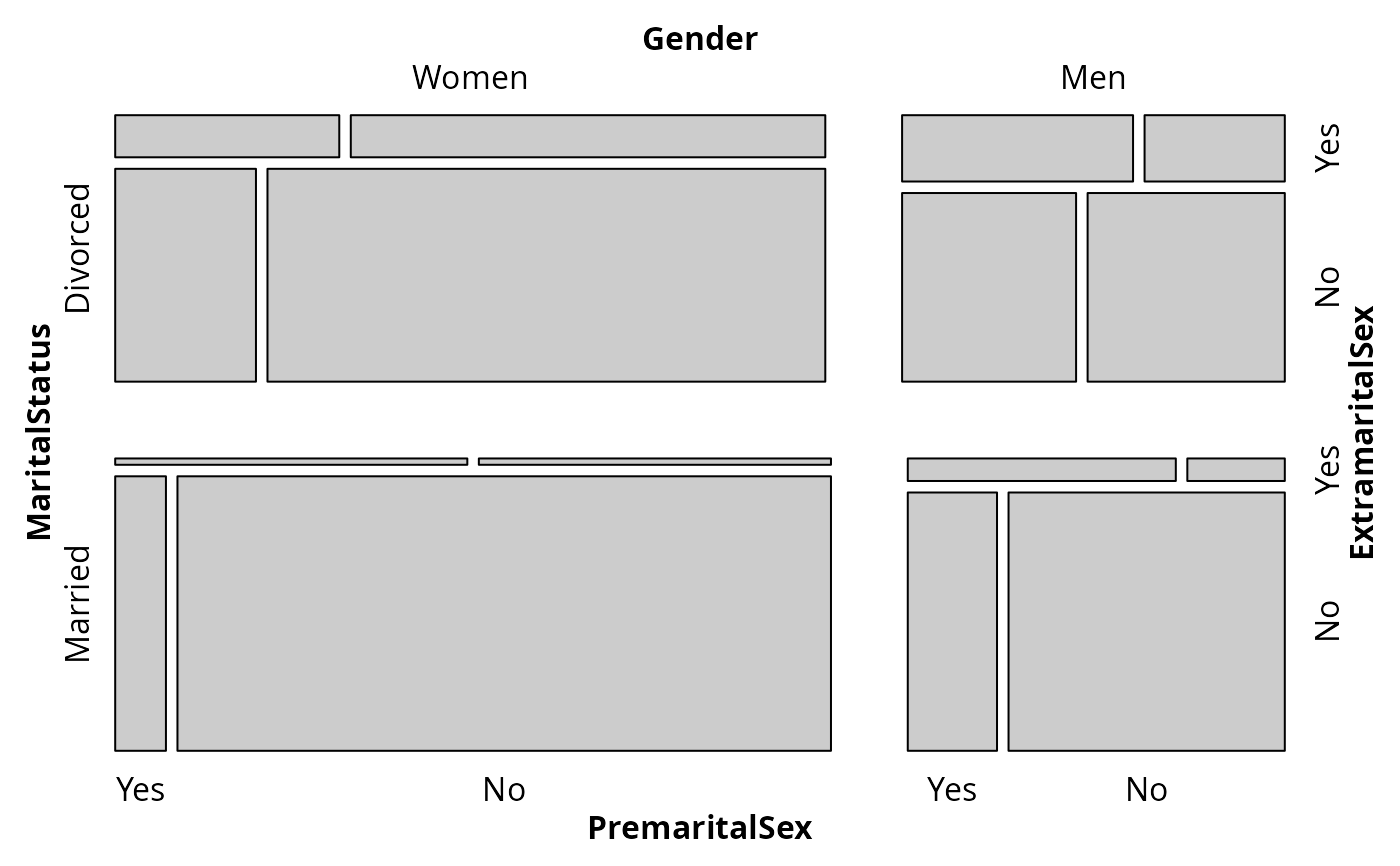
 data("PreSex")
strucplot(aperm(PreSex, c(1,4,2,3)), spacing = spacing_conditional,
condvars = 2)
data("PreSex")
strucplot(aperm(PreSex, c(1,4,2,3)), spacing = spacing_conditional,
condvars = 2)