Off-diagonal Panel Functions for Table Pairs Plot
panel_pairs_off-diagonal.RdOff-diagonal panel functions for pairs.table.
Arguments
- panel
function to be used for the plots in each cell, such as
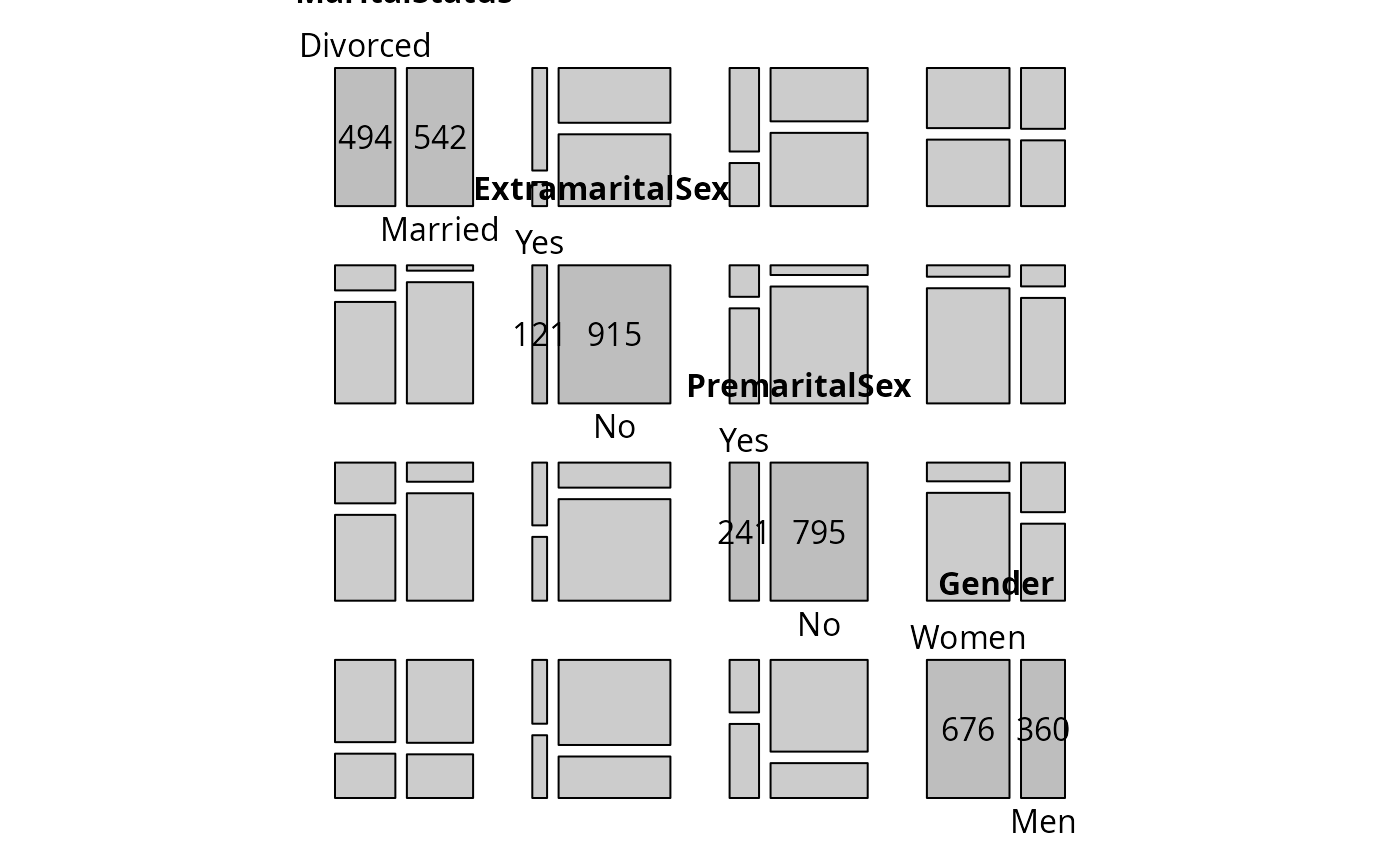
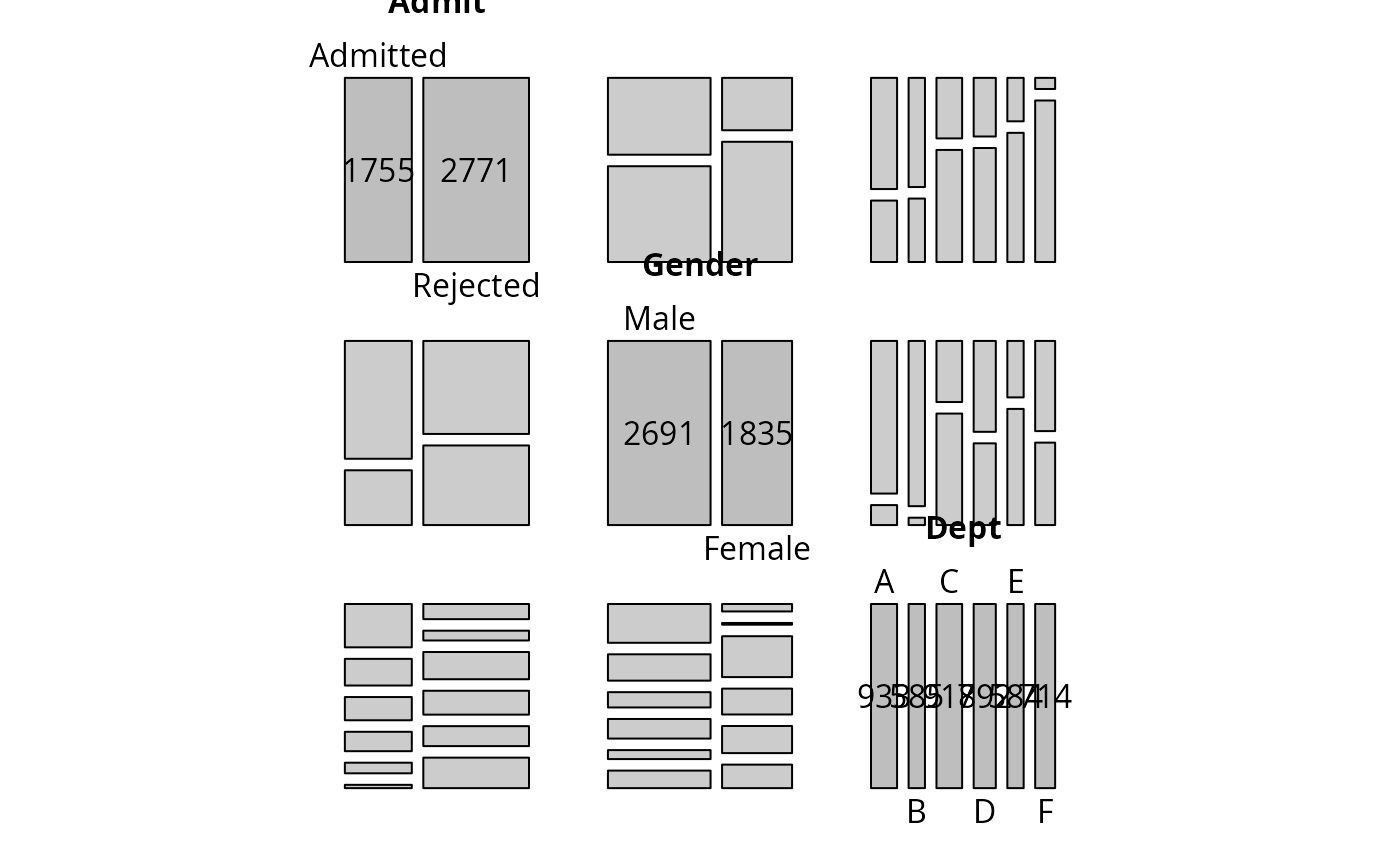
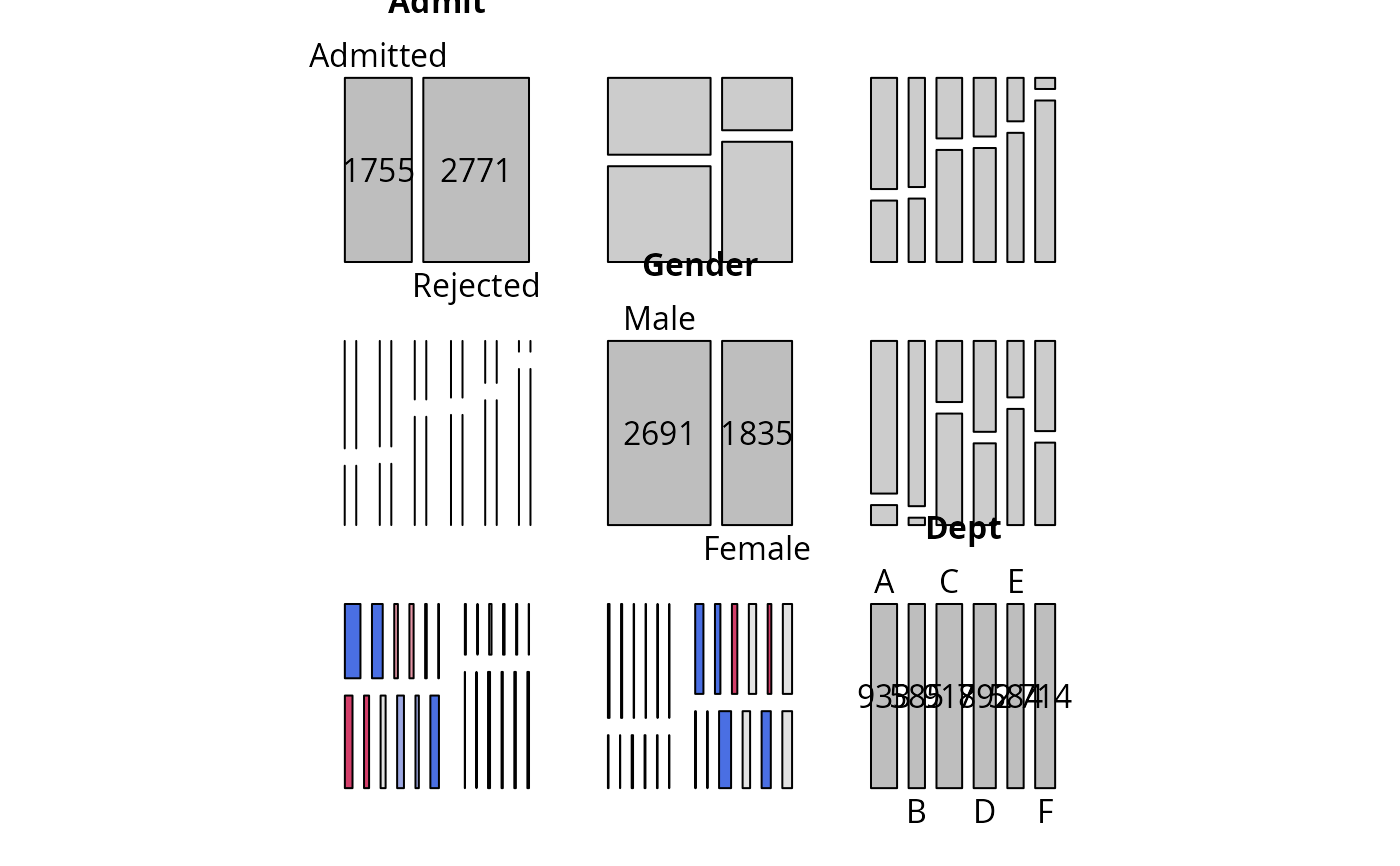
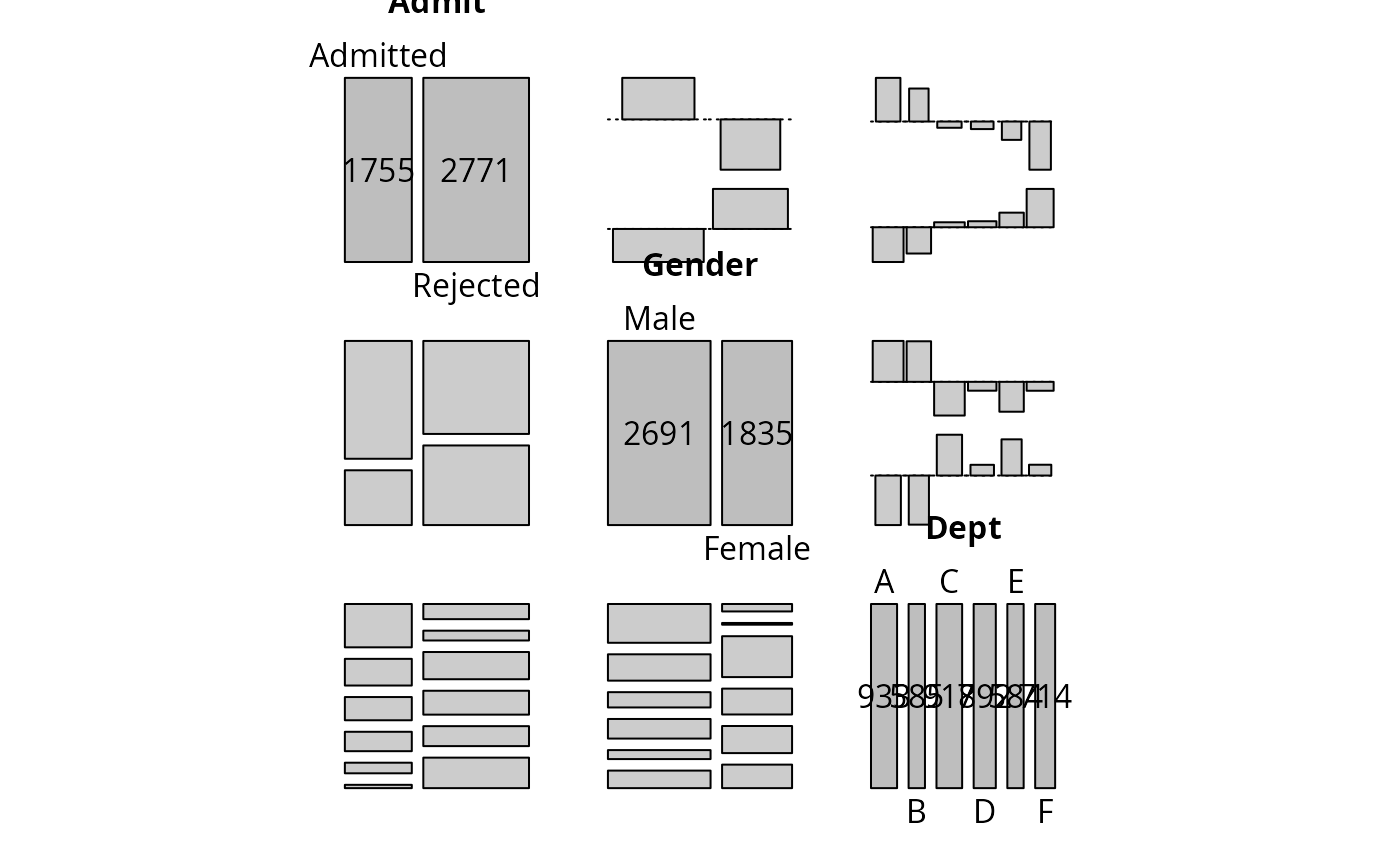
pairs_assoc,pairs_mosaic, andpairs_sieve.- type
character string specifying the type of independence model visualized in the cells.
- legend
logical specifying whether a legend should be displayed in the cells or not.
- margins
margins inside each cell (see
strucplot).- labeling
labeling function or labeling-generating function (see
strucplot).- ...
pairs_mosaic,pairs_assoc, andpairs_sieve: parameters passed topairs_strucplot.pairs_strucplot: other parameters passed to panel function.
Details
These functions really just wrap assoc, sieve, and
mosaic by basically inhibiting labeling and
legend-drawing and setting the margins to 0.
Value
A function with arguments:
- x
contingency table.
- i, j
cell coordinates.
See also
References
Cohen, A. (1980), On the graphical display of the significant components in a two-way contingency table. Communications in Statistics—Theory and Methods, A9, 1025–1041.
Friendly, M. (1992), Graphical methods for categorical data. SAS User Group International Conference Proceedings, 17, 190–200. http://datavis.ca/papers/sugi/sugi17.pdf