Visual Acuity in Left and Right Eyes
VisualAcuity.RdData from Kendall & Stuart (1961) on unaided vision among 3,242 men and 7,477 women, all aged 30-39 and employed in the U.K. Royal Ordnance factories 1943-1946.
data("VisualAcuity")Format
A data frame with 32 observations and 4 variables.
- Freq
frequency of visual acuity measurements.
- right
visual acuity on right eye.
- left
visual acuity on left eye.
- gender
factor indicating gender of patient.
References
M. G. Kendall & A. Stuart (1961), The Advanced Theory of Statistics, Vol. 2. Griffin, London.
M. Friendly (2000), Visualizing Categorical Data. SAS Institute, Cary, NC.
Source
M. Friendly (2000), Visualizing Categorical Data: http://euclid.psych.yorku.ca/ftp/sas/vcd/catdata/vision.sas
Examples
data("VisualAcuity")
structable(~ gender + left + right, data = VisualAcuity)
#> left 1 2 3 4
#> gender right
#> male 1 821 112 85 35
#> 2 116 494 145 27
#> 3 72 151 583 87
#> 4 43 34 106 331
#> female 1 1520 266 124 66
#> 2 234 1512 432 78
#> 3 117 362 1772 205
#> 4 36 82 179 492
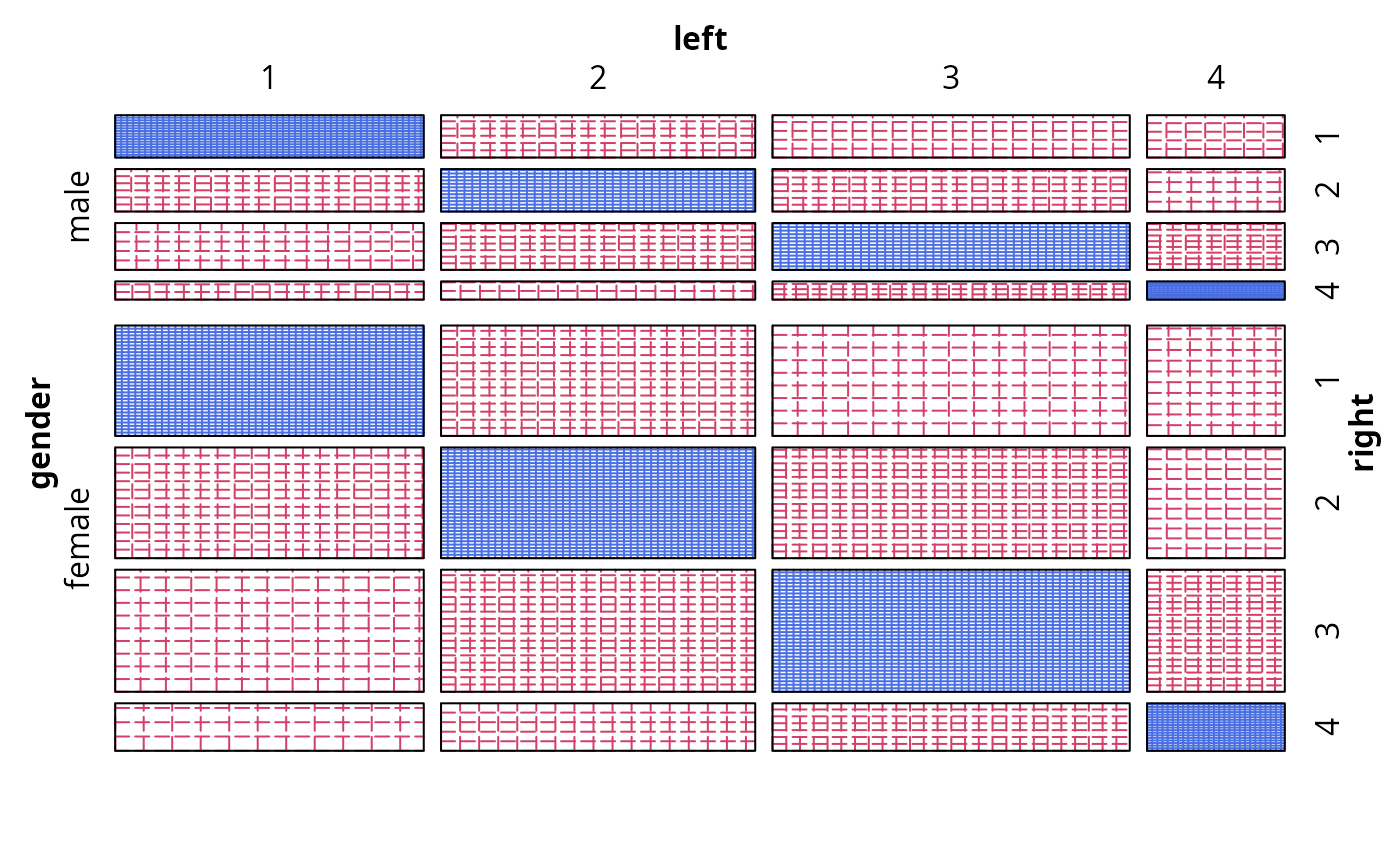
sieve(Freq ~ left + right | gender, data = VisualAcuity, shade = TRUE)
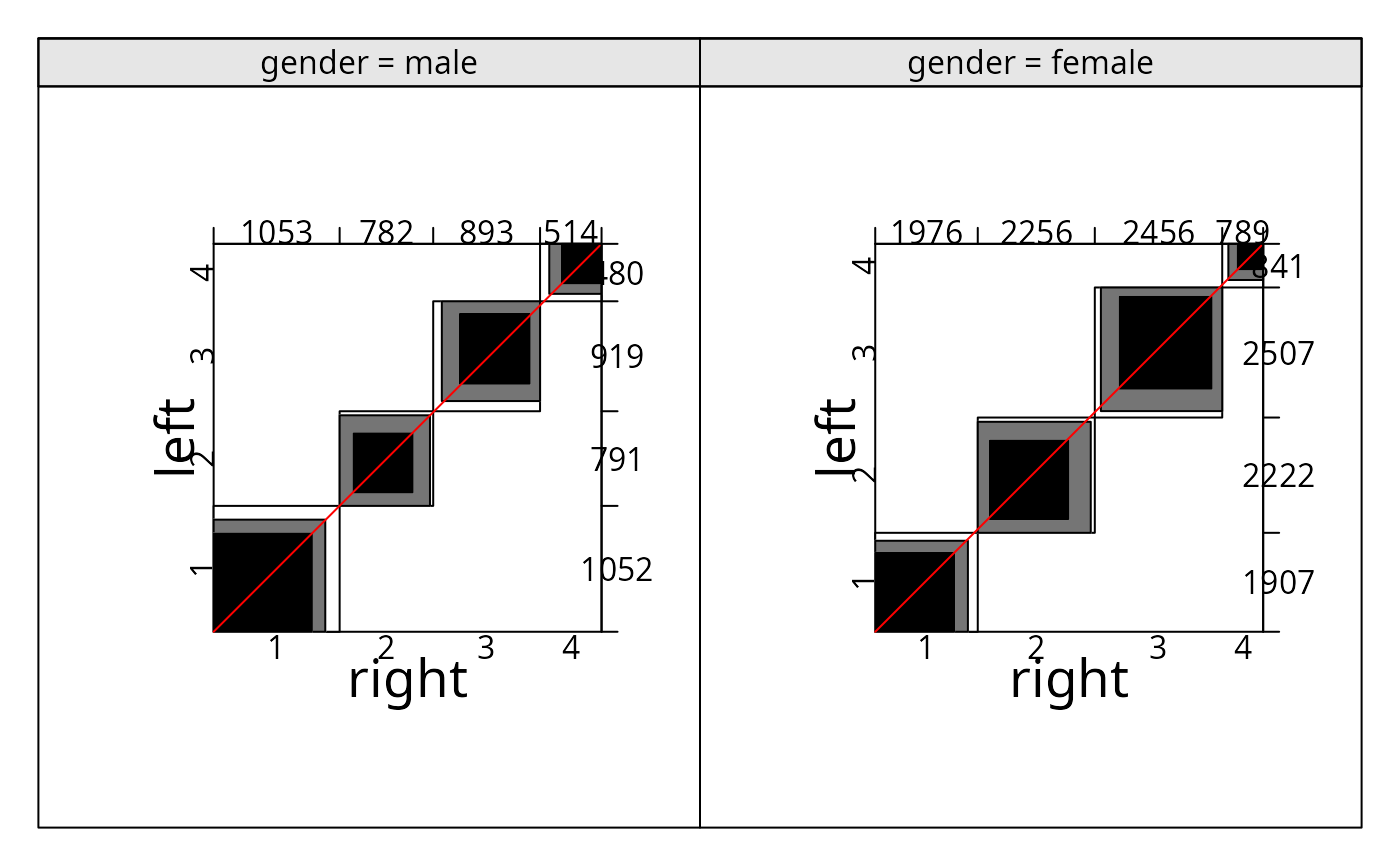
 cotabplot(Freq ~ left + right | gender, data = VisualAcuity,
panel = cotab_agreementplot)
cotabplot(Freq ~ left + right | gender, data = VisualAcuity,
panel = cotab_agreementplot)