Rochdale Data
Rochdale.RdInformation on 665 households of Rochdale, Lancashire, UK. The study was conducted to identify influence factors on economical activity of wives.
data("Rochdale")Format
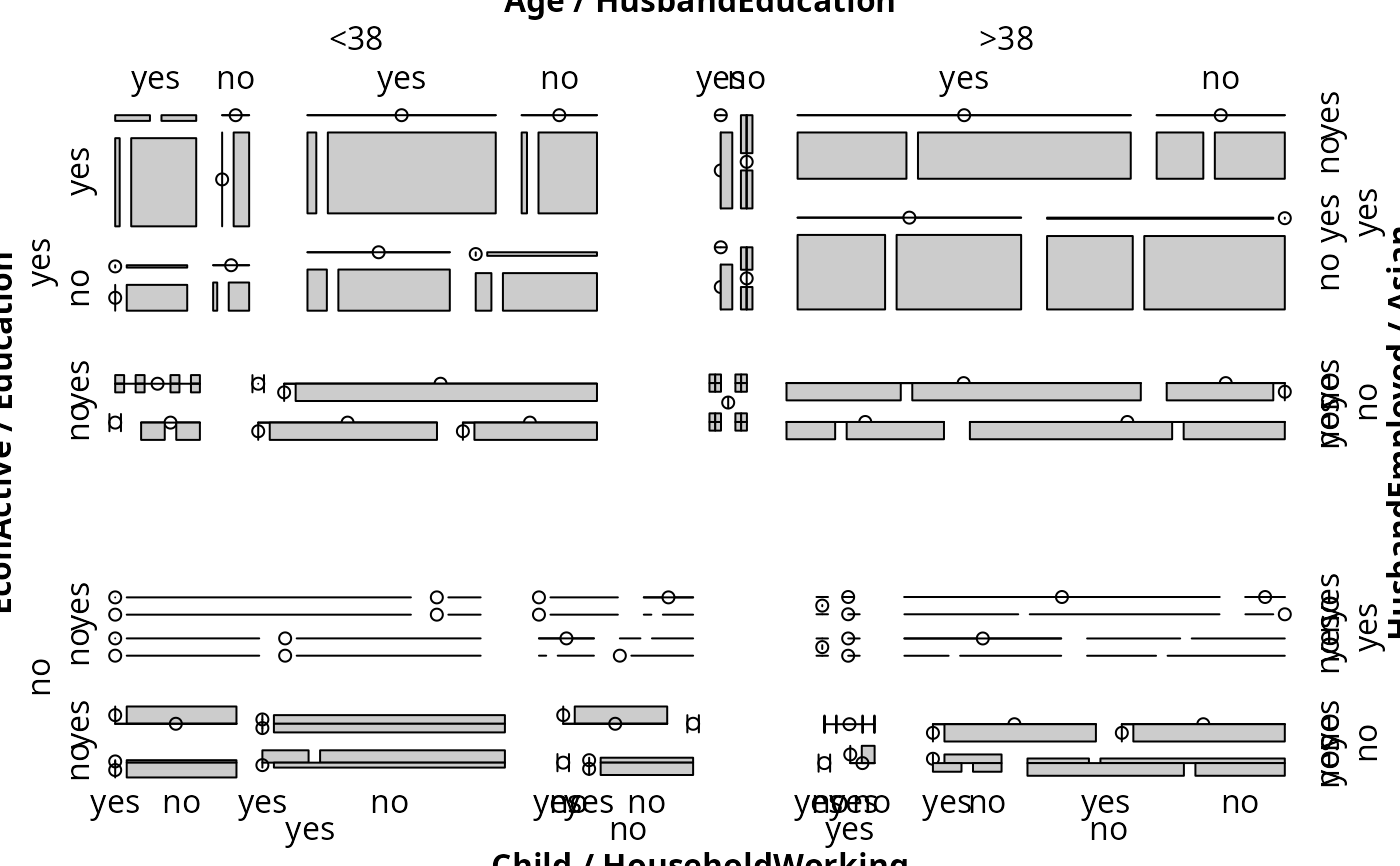
A 8-dimensional array resulting from cross-tabulating 665 observations on 8 variables. The variables and their levels are as follows:
| No | Name | Levels |
| 1 | EconActive | yes, no |
| 2 | Age | <38, >38 |
| 3 | HusbandEmployed | yes, no |
| 4 | Child | yes, no |
| 5 | Education | yes, no |
| 6 | HusbandEducation | yes, no |
| 7 | Asian | yes, no |
| 8 | HouseholdWorking | yes, no |
Note
Many observations are missing: only 91 out of all 256 combinations contain information.
Source
Whittaker (1990).
References
H. Hofmann (2003). Constructing and reading mosaicplots. Computational Statistics & Data Analysis, 43, 4, 565–580.
J. Whittaker (1990), Graphical Models on Applied Multivariate Statistics, Wiley, New York.