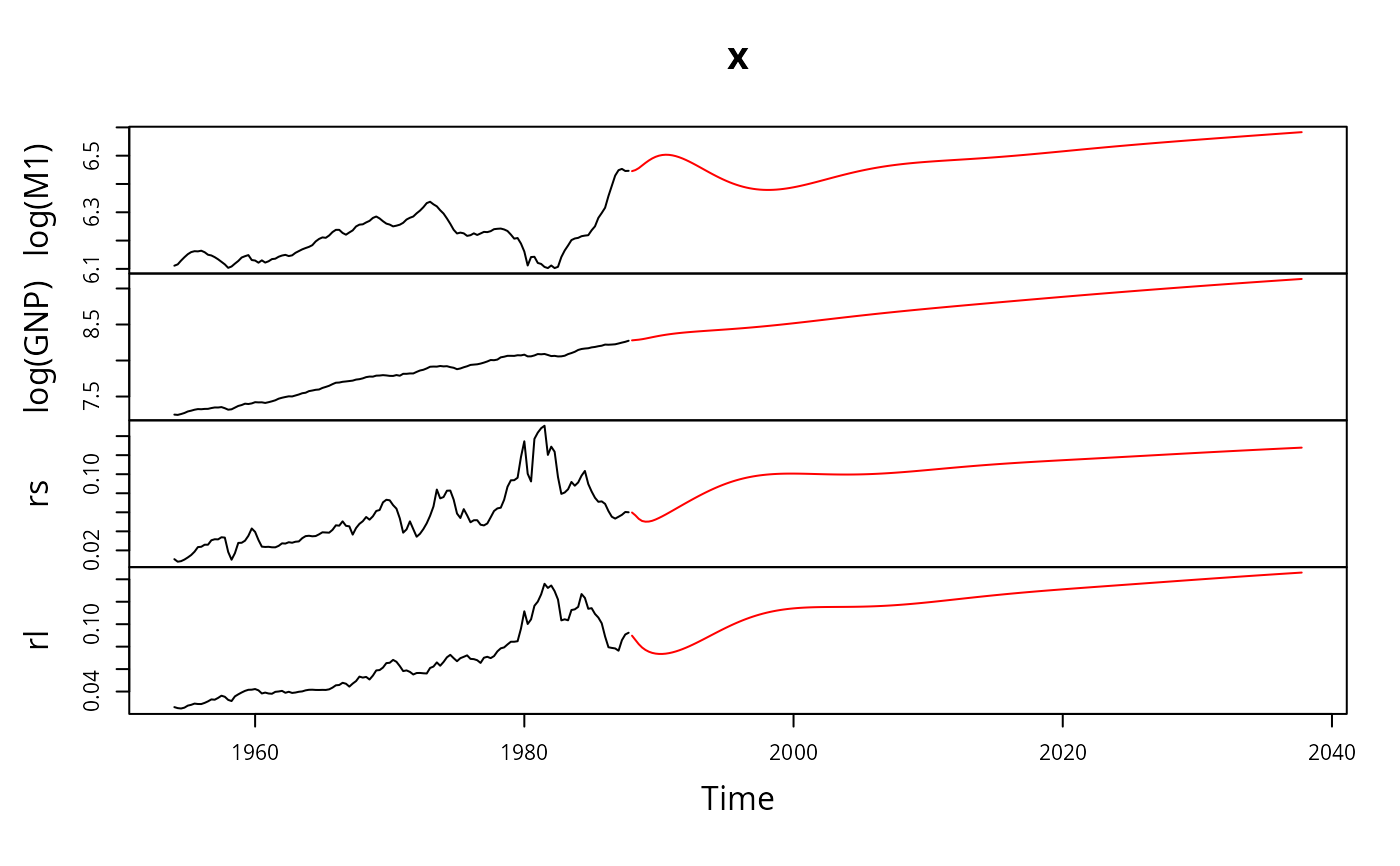
Plot Two Time Series
seqplot.ts.RdPlot two time series on the same plot frame.
Usage
seqplot.ts(x, y, colx = "black", coly = "red", typex = "l",
           typey = "l", pchx = 1, pchy = 1, ltyx = "solid",
           ltyy = "solid", oma = c(6, 0, 5, 0), ann = par("ann"),
           xlab = "Time", ylab = deparse(substitute(x)), main = NULL)
Arguments
- x, y
the time series.
- colx, coly
color code or name for the
xandyseries, seecolors,palette.- typex, typey
what type of plot should be drawn for the
xandyseries, seeplot.- pchx, pchy
character or integer code for kind of points/lines for the
xandyseries.- ltyx, ltyy
line type code for the
xandyseries, seelines.- oma
a vector giving the size of the outer margins in lines of text, see
par.- ann
annotate the plots? See
par.- xlab, ylab
titles for the x and y axis.
- main
an overall title for the plot.