![[Experimental]](figures/lifecycle-experimental.svg)
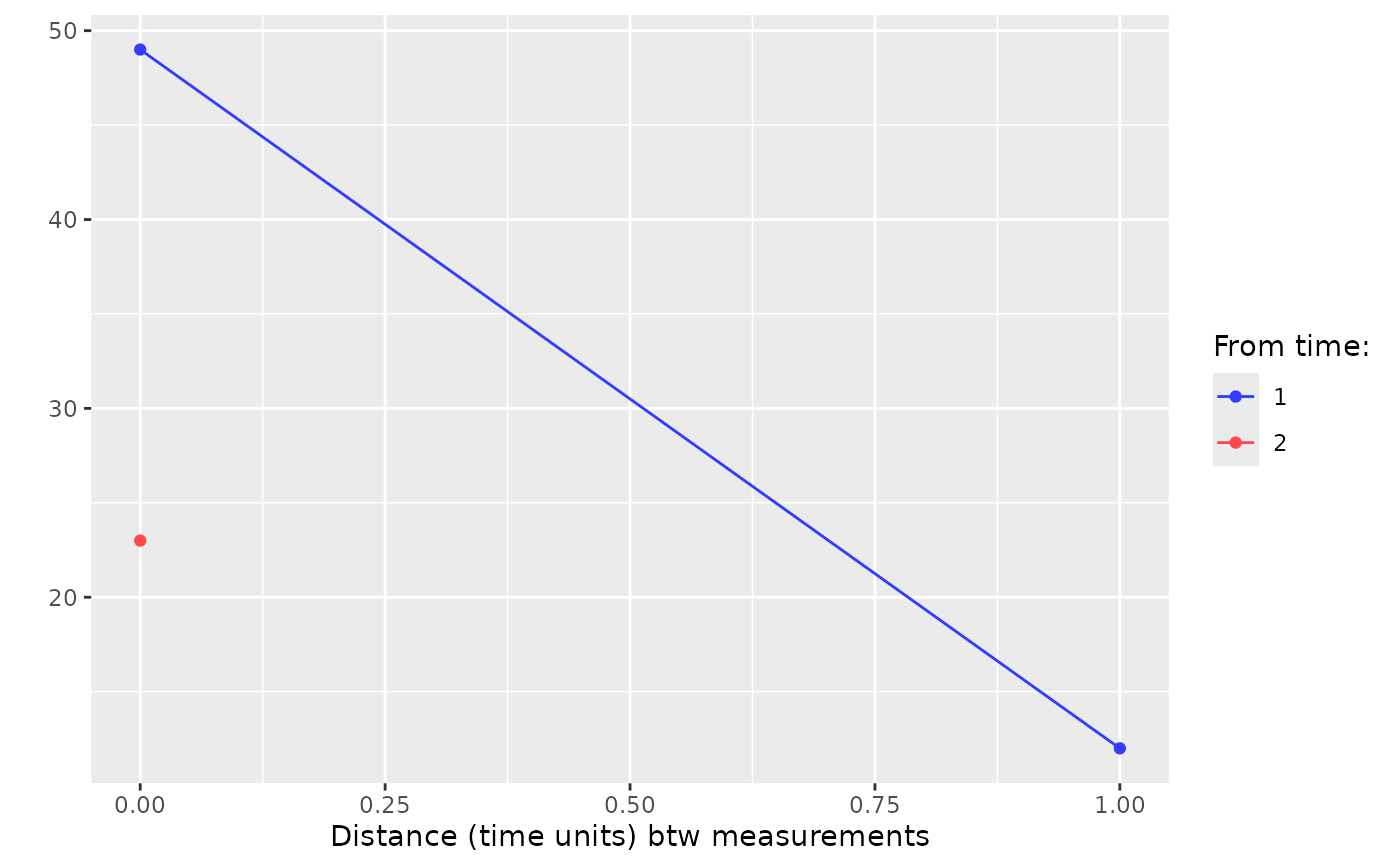
Plot of covariance (or correlation) matrix as a function of lag or time. The covariance structure is vectorized internally and lag or time distances are computed and can be used for visualization.
g_covariance(
  vcov_matrix,
  time_prefix = NULL,
  x_var = c("lag", "time_diff"),
  xlab = NULL,
  ylab = ""
)
Arguments
- vcov_matrix
(
matrix)
symmetric covariance matrix with identical row and column names.- time_prefix
(
string)
string in the names ofvcov_matrixthat precedes the time point value.- x_var
(
string)
can belagortime_difffor lag or time difference, respectively.- xlab
(
stringorNULL)
x-axis label, ifNULLthen automatically determined fromx_var.- ylab
(
string)
y-axis label.
Value
The ggplot object.
Details
The default time_prefix value is NULL, which assumes that the names
of the input matrix don't have any character string other than time point
value. If a time_prefix is specified, this string should appear in front of
all the names in vcov_matrix.