Predicted Values for a `survreg' Object
predict.survreg.RdPredicted values for a survreg object
Arguments
- object
result of a model fit using the
survregfunction.- newdata
data for prediction. If absent predictions are for the subjects used in the original fit.
- type
the type of predicted value. This can be on the original scale of the data (response), the linear predictor (
"linear", with"lp"as an allowed abbreviation), a predicted quantile on the original scale of the data ("quantile"), a quantile on the linear predictor scale ("uquantile"), or the matrix of terms for the linear predictor ("terms"). At this time"link"and linear predictor ("lp") are identical.- se.fit
if
TRUE, include the standard errors of the prediction in the result.- terms
subset of terms. The default for residual type
"terms"is a matrix with one column for every term (excluding the intercept) in the model.- p
vector of percentiles. This is used only for quantile predictions.
- na.action
applies only when the
newdataargument is present, and defines the missing value action for the new data. The default is to include all observations.- ...
for future methods
References
Escobar and Meeker (1992). Assessing influence in regression analysis with censored data. Biometrics, 48, 507-528.
Examples
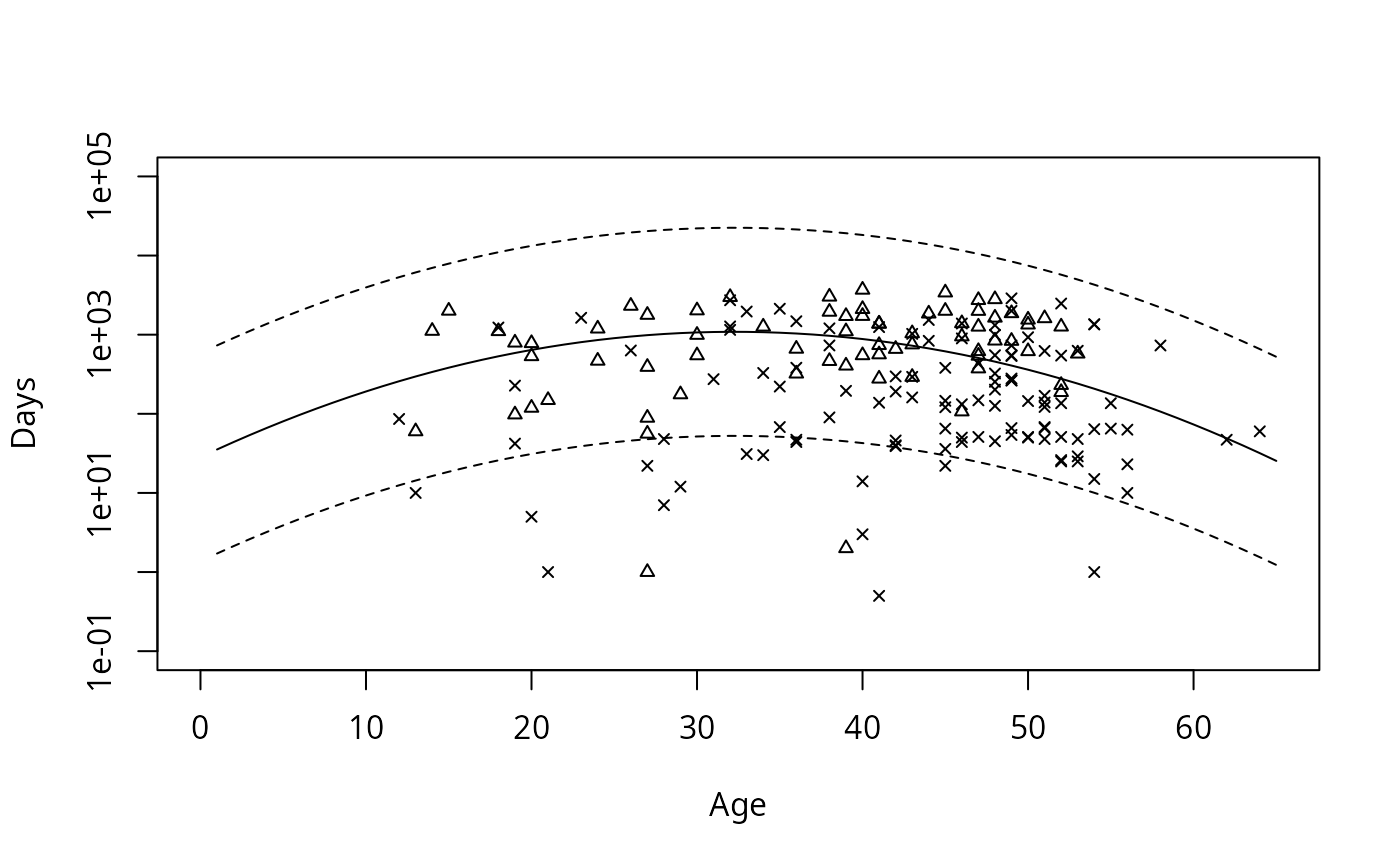
# Draw figure 1 from Escobar and Meeker, 1992.
fit <- survreg(Surv(time,status) ~ age + I(age^2), data=stanford2,
dist='lognormal')
with(stanford2, plot(age, time, xlab='Age', ylab='Days',
xlim=c(0,65), ylim=c(.1, 10^5), log='y', type='n'))
with(stanford2, points(age, time, pch=c(2,4)[status+1], cex=.7))
pred <- predict(fit, newdata=list(age=1:65), type='quantile',
p=c(.1, .5, .9))
matlines(1:65, pred, lty=c(2,1,2), col=1)
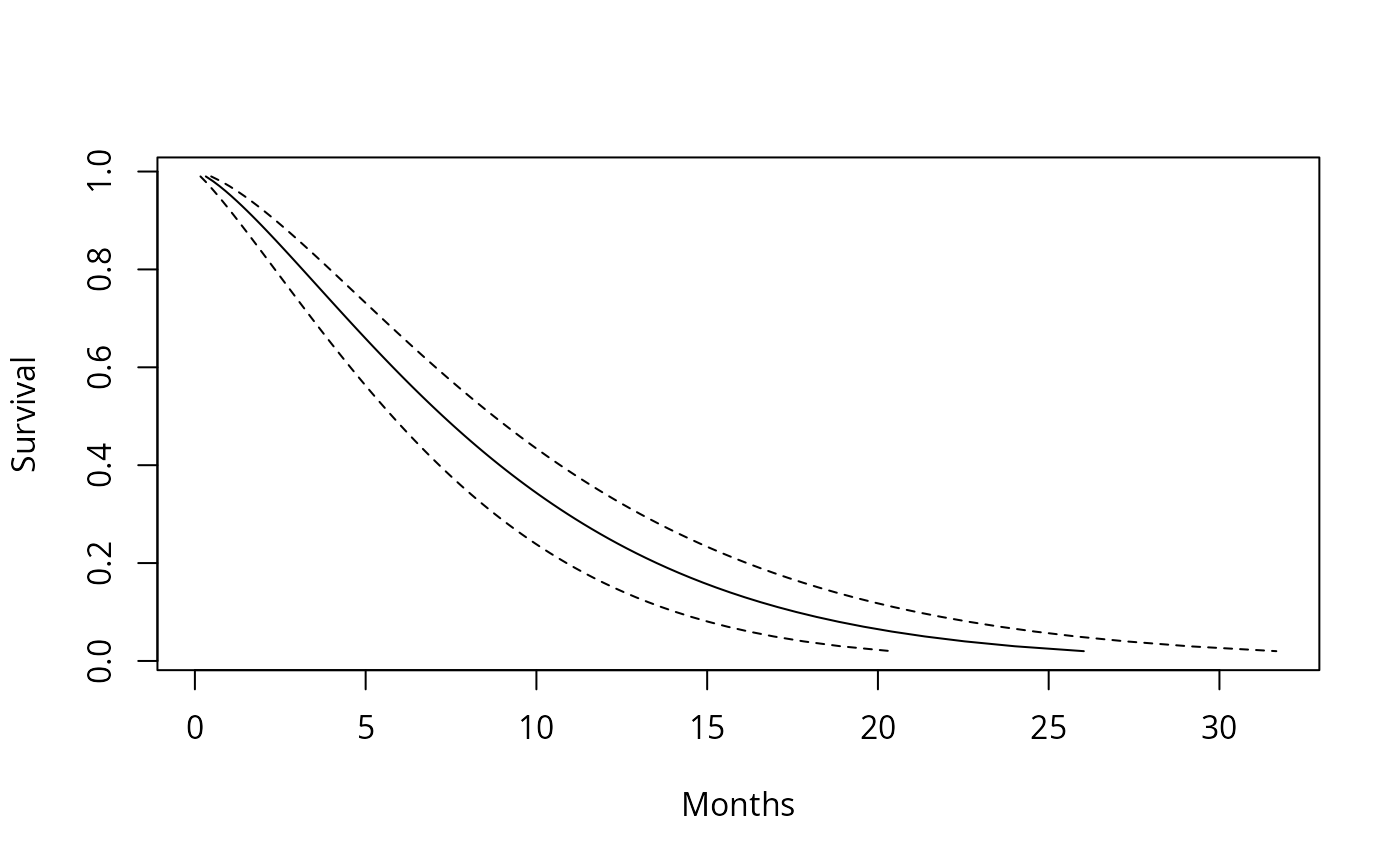
 # Predicted Weibull survival curve for a lung cancer subject with
# ECOG score of 2
lfit <- survreg(Surv(time, status) ~ ph.ecog, data=lung)
pct <- 1:98/100 # The 100th percentile of predicted survival is at +infinity
ptime <- predict(lfit, newdata=data.frame(ph.ecog=2), type='quantile',
p=pct, se=TRUE)
matplot(cbind(ptime$fit, ptime$fit + 2*ptime$se.fit,
ptime$fit - 2*ptime$se.fit)/30.5, 1-pct,
xlab="Months", ylab="Survival", type='l', lty=c(1,2,2), col=1)
# Predicted Weibull survival curve for a lung cancer subject with
# ECOG score of 2
lfit <- survreg(Surv(time, status) ~ ph.ecog, data=lung)
pct <- 1:98/100 # The 100th percentile of predicted survival is at +infinity
ptime <- predict(lfit, newdata=data.frame(ph.ecog=2), type='quantile',
p=pct, se=TRUE)
matplot(cbind(ptime$fit, ptime$fit + 2*ptime$se.fit,
ptime$fit - 2*ptime$se.fit)/30.5, 1-pct,
xlab="Months", ylab="Survival", type='l', lty=c(1,2,2), col=1)