Scatterplot smoothing and density estimation
svysmooth.RdScatterplot smoothing and density estimation for probability-weighted data.
Usage
svysmooth(formula, design, ...)
# Default S3 method
svysmooth(formula, design, method = c("locpoly", "quantreg"),
    bandwidth = NULL, quantile, df = 4, ...)
# S3 method for class 'svysmooth'
plot(x, which=NULL, type="l", xlabs=NULL, ylab=NULL,...)
# S3 method for class 'svysmooth'
lines(x,which=NULL,...)
make.panel.svysmooth(design,bandwidth=NULL)
Arguments
- formula
One-sided formula for density estimation, two-sided for smoothing
- design
Survey design object
- method
local polynomial smoothing for the mean or regression splines for quantiles
- bandwidth
Smoothing bandwidth for "locpoly" or
NULLfor automatic choice- quantile
quantile to be estimated for "quantreg"
- df
Degrees of freedom for "quantreg"
- which
Which plots to show (default is all)
- type
as for
plot- xlabs
Optional vector of x-axis labels
- ylab
Optional y-axis label
- ...
More arguments
- x
Object of class
svysmooth
Details
svysmooth does one-dimensional smoothing. If formula has
multiple predictor variables a separate one-dimensional smooth is
performed for each one.
For method="locpoly" the extra arguments are passed to
locpoly from the KernSmooth package, for
method="quantreg" they are passed to rq from the
quantreg package. The automatic choice of bandwidth for
method="locpoly" uses the default settings for dpik and
dpill in the KernSmooth package.
make.panel.svysmooth() makes a function that plots points and
draws a weighted smooth curve through them, a weighted replacement for
panel.smooth that can be passed to functions such as
termplot or plot.lm. The resulting function has a span argument that will set the bandwidth; if this is not specified the automatic choice will be used.
See also
svyhist for histograms
Examples
data(api)
dstrat<-svydesign(id=~1,strata=~stype, weights=~pw, data=apistrat, fpc=~fpc)
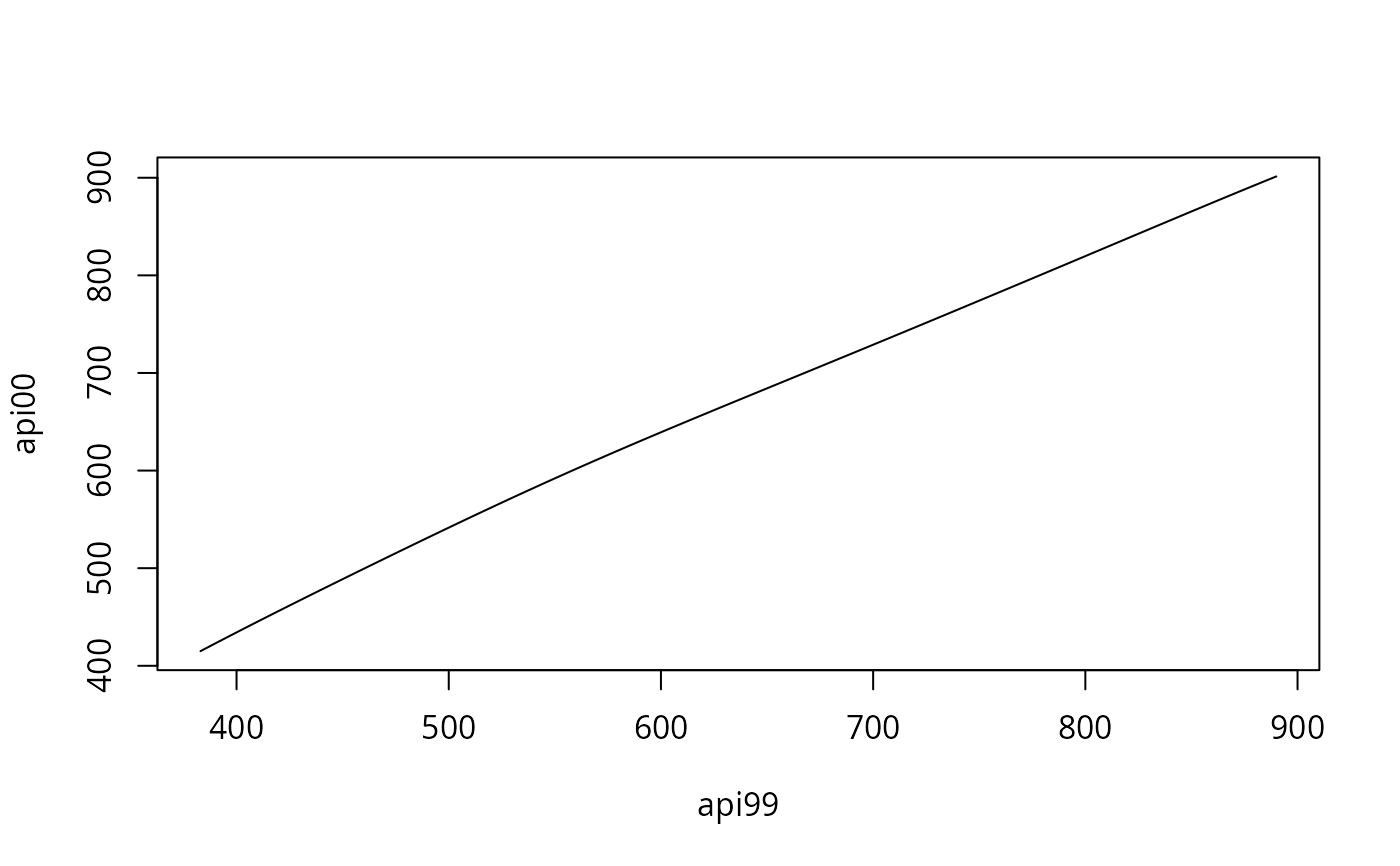
smth<-svysmooth(api00~api99+ell,dstrat)
dens<-svysmooth(~api99, dstrat,bandwidth=30)
dens1<-svysmooth(~api99, dstrat)
qsmth<-svysmooth(api00~ell,dstrat, quantile=0.75, df=3,method="quantreg")
plot(smth)
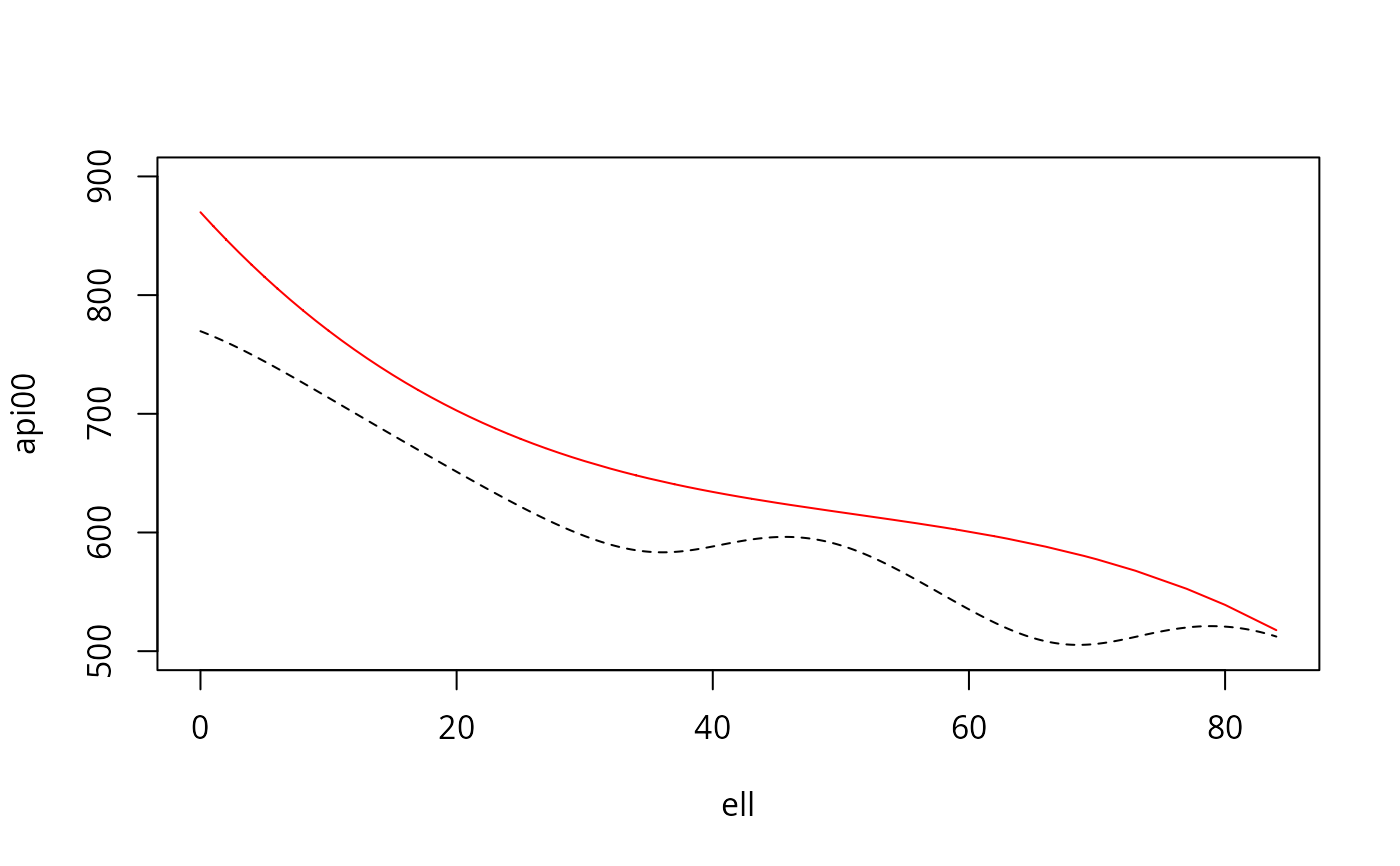
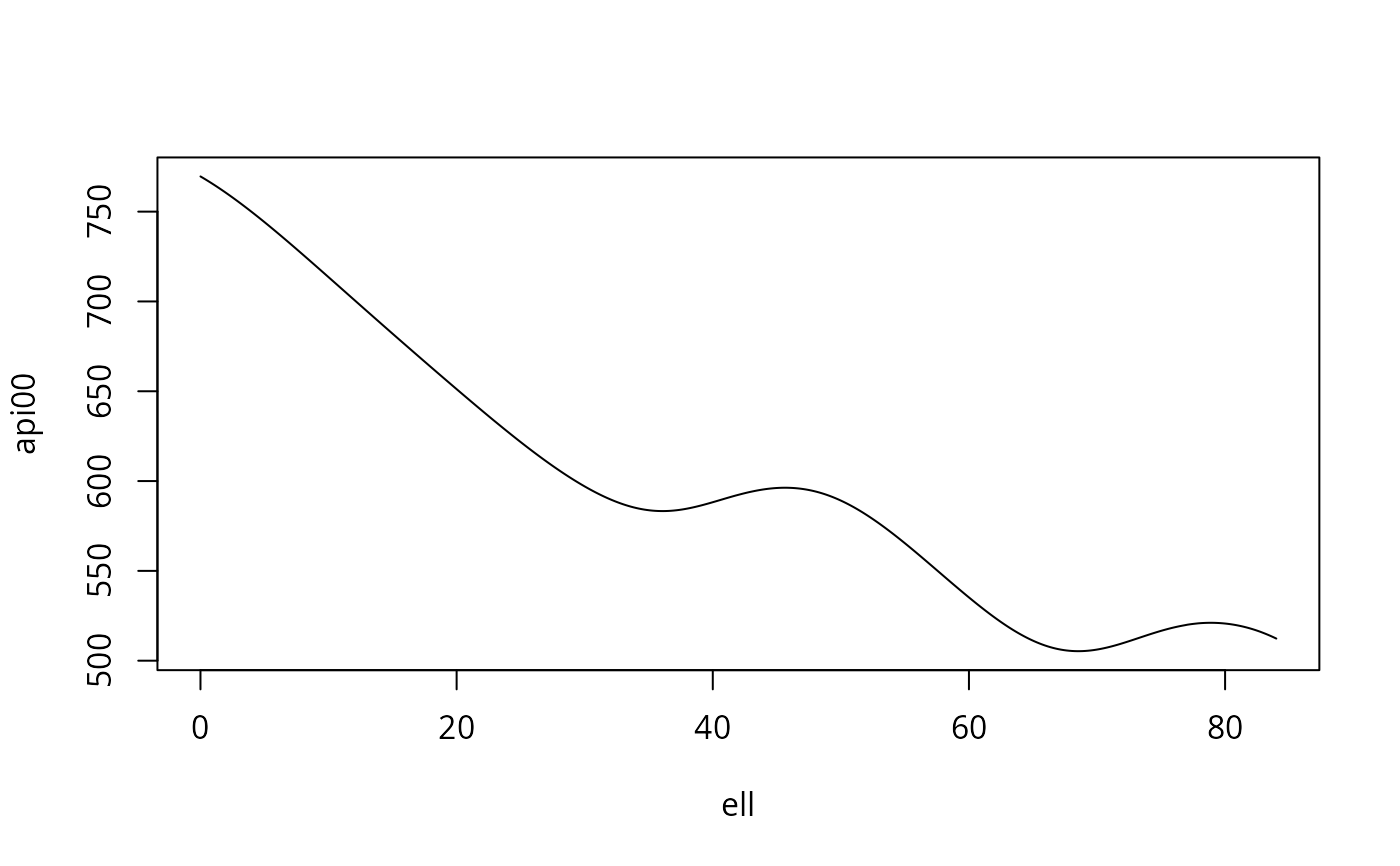 plot(smth, which="ell",lty=2,ylim=c(500,900))
lines(qsmth, col="red")
plot(smth, which="ell",lty=2,ylim=c(500,900))
lines(qsmth, col="red")
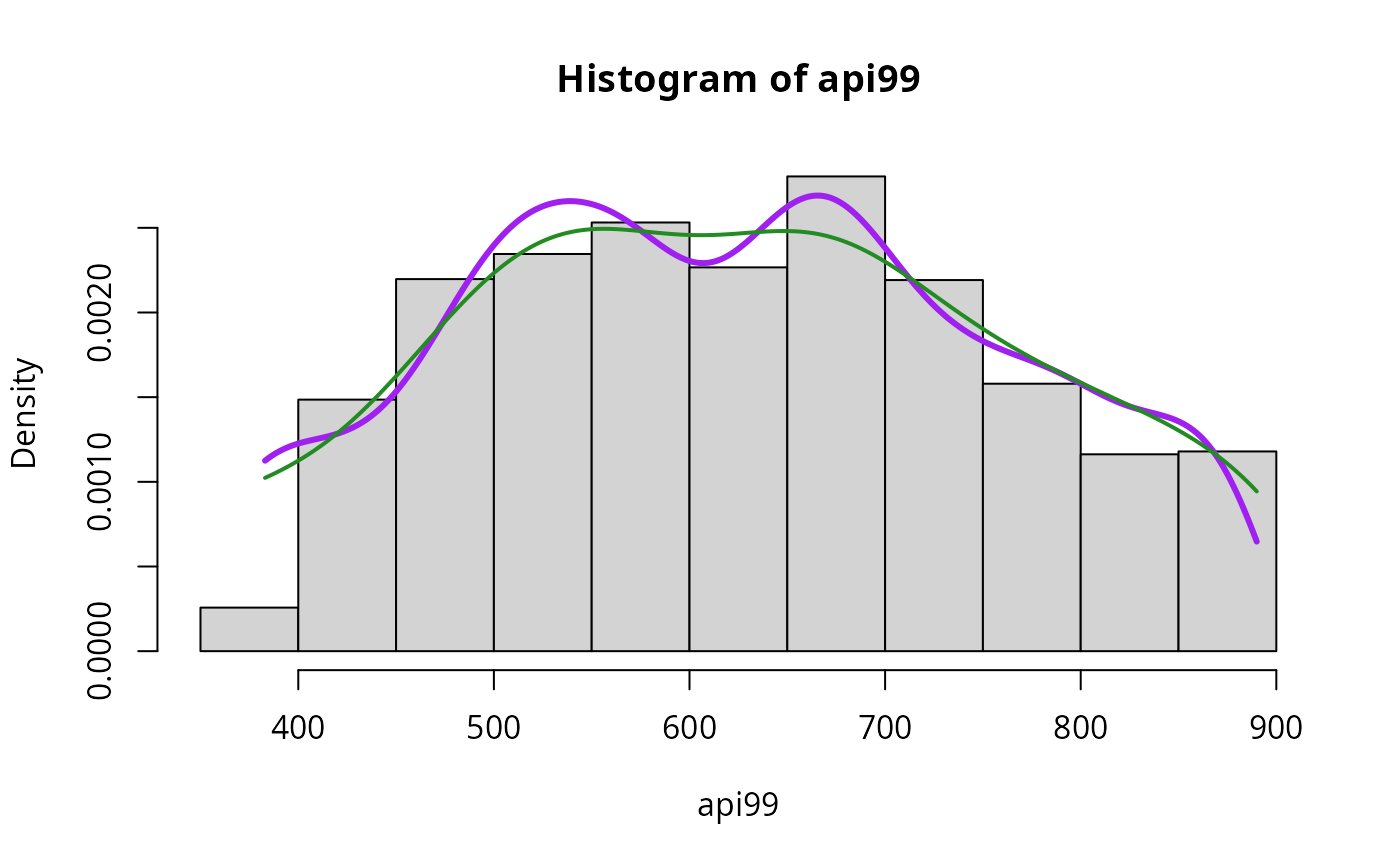
 svyhist(~api99,design=dstrat)
lines(dens,col="purple",lwd=3)
lines(dens1, col="forestgreen",lwd=2)
svyhist(~api99,design=dstrat)
lines(dens,col="purple",lwd=3)
lines(dens1, col="forestgreen",lwd=2)
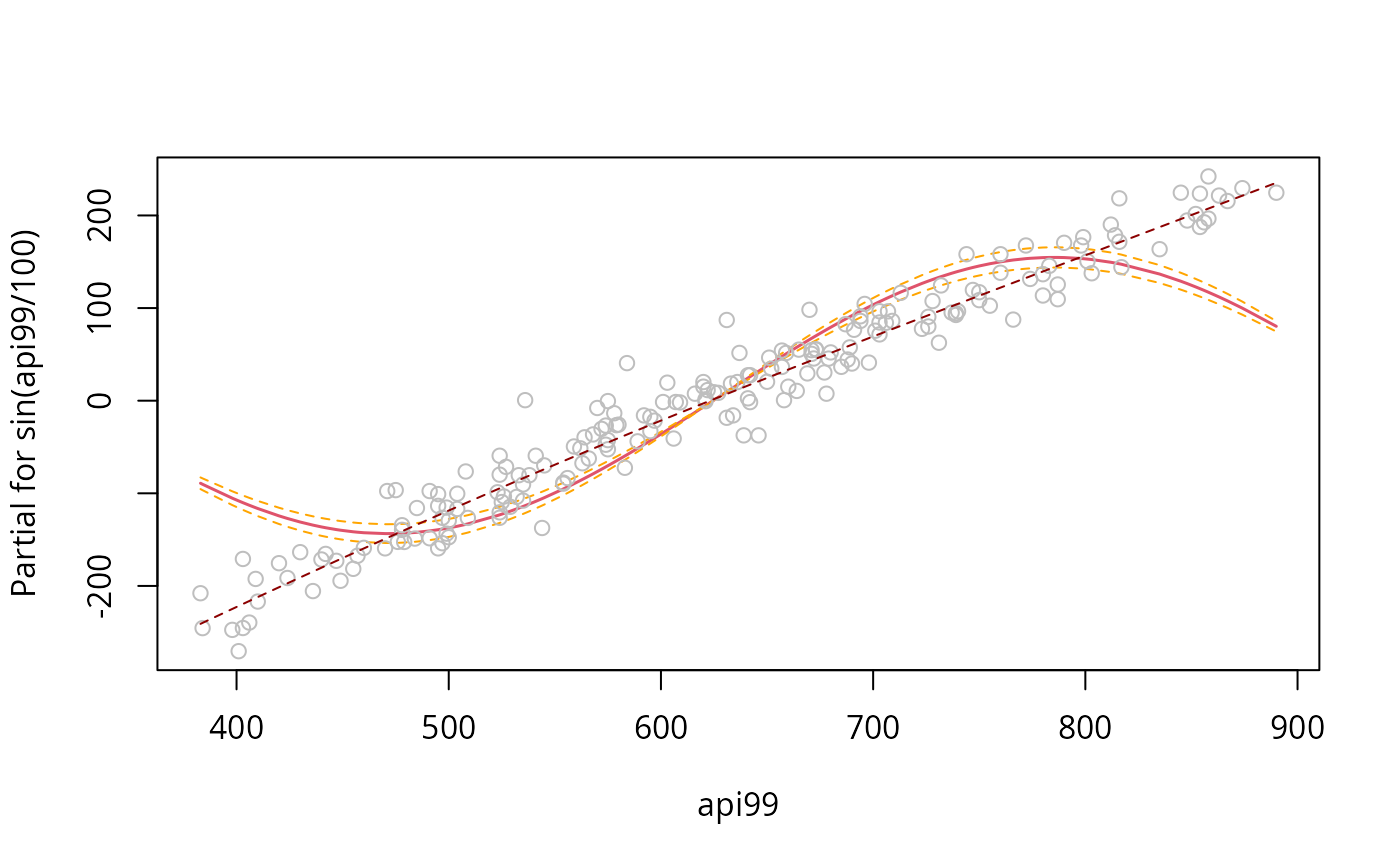
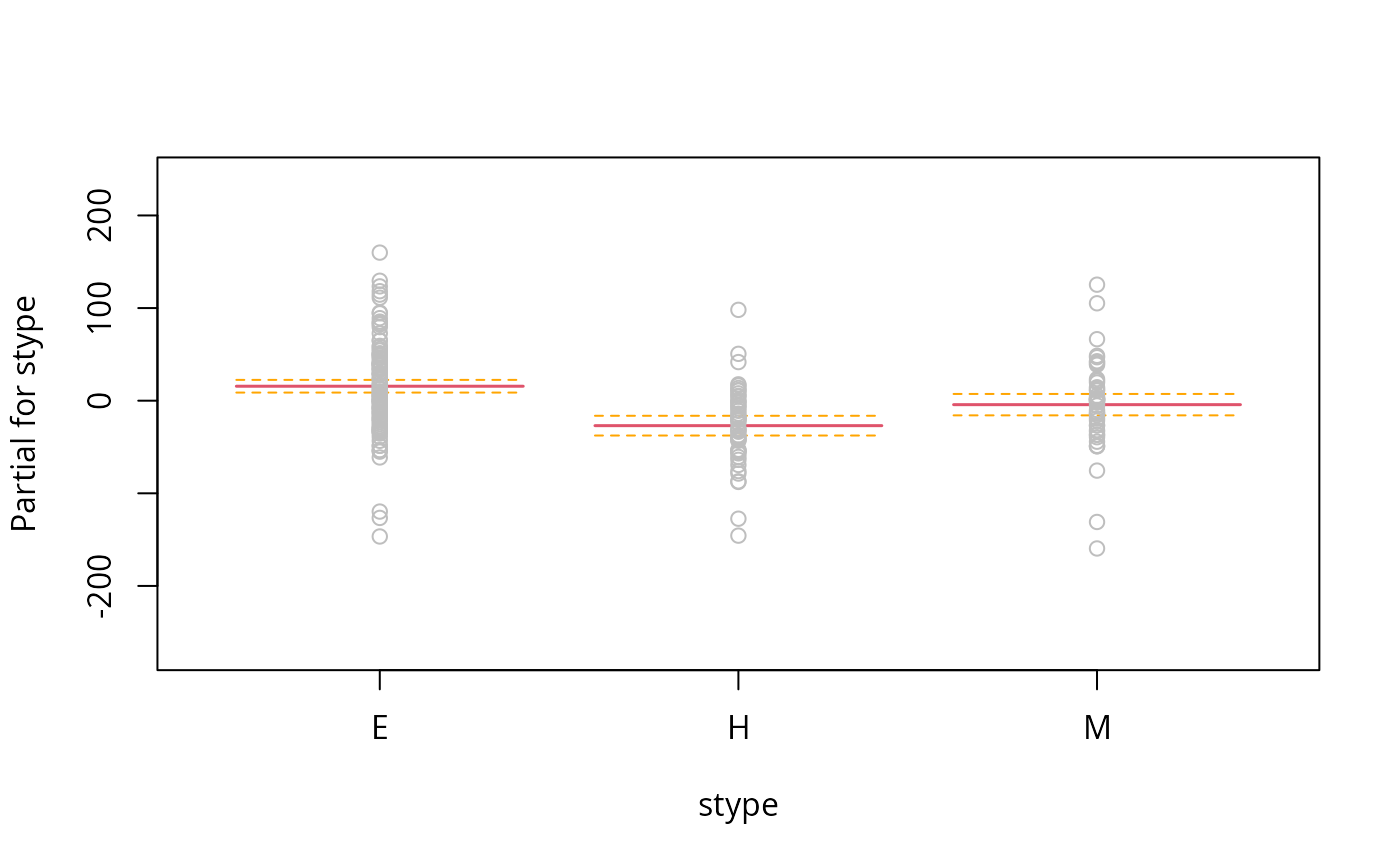
 m<-svyglm(api00~sin(api99/100)+stype, design=dstrat)
termplot(m, data=model.frame(dstrat), partial.resid=TRUE, se=TRUE,
smooth=make.panel.svysmooth(dstrat))
m<-svyglm(api00~sin(api99/100)+stype, design=dstrat)
termplot(m, data=model.frame(dstrat), partial.resid=TRUE, se=TRUE,
smooth=make.panel.svysmooth(dstrat))