Quantile-quantile plots for survey data
svyqqplot.RdQuantile-quantile plots either against a specified distribution function or comparing two variables from the same or different designs.
Usage
svyqqplot(formula, design, designx = NULL, na.rm = TRUE, qrule = "hf8",
xlab = NULL, ylab = NULL, ...)
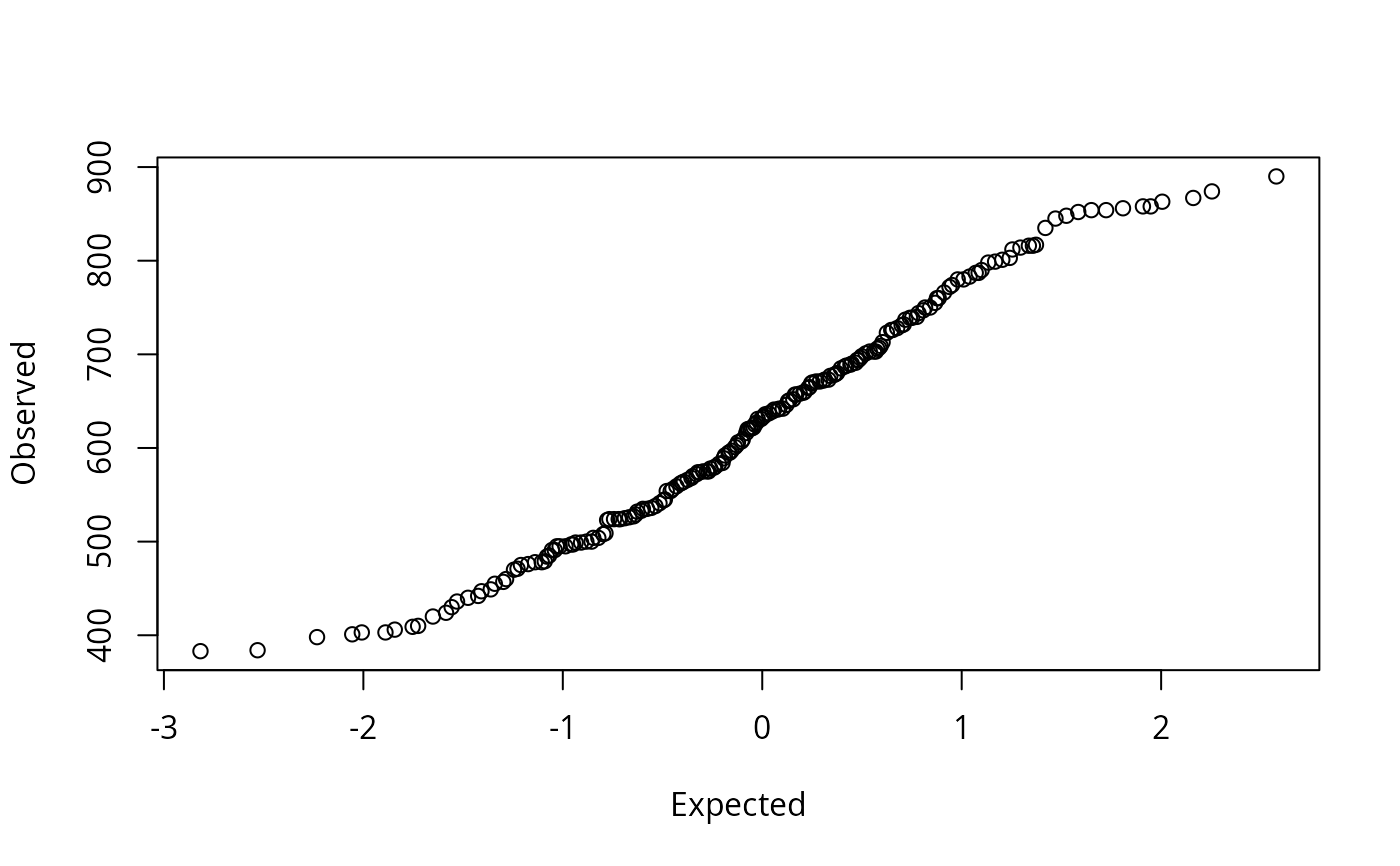
svyqqmath(x, design, null=qnorm, na.rm=TRUE, xlab="Expected",ylab="Observed",...)Arguments
- x,formula
A one-sided formula for
svyqqmathor a two-sided formula forsvyqqplot- design
Survey design object to look up variables
- designx
Survey design object to look up the RHS variable in
svyqqplot, if different from the LHS variable- null
Quantile function to compare the data quantiles to
- na.rm
Remove missing values
- qrule
How to define quantiles for
svyqqplot– seesvyquantilefor possible values- xlab,ylab
Passed to
plot. Forsvyqqplot, if these areNULLthey are replaced by the variable names- ...
Graphical options to be passed to
plot
Examples
data(api)
dstrat<-svydesign(id=~1,strata=~stype, weights=~pw, data=apistrat,
fpc=~fpc)
svyqqmath(~api99, design=dstrat)
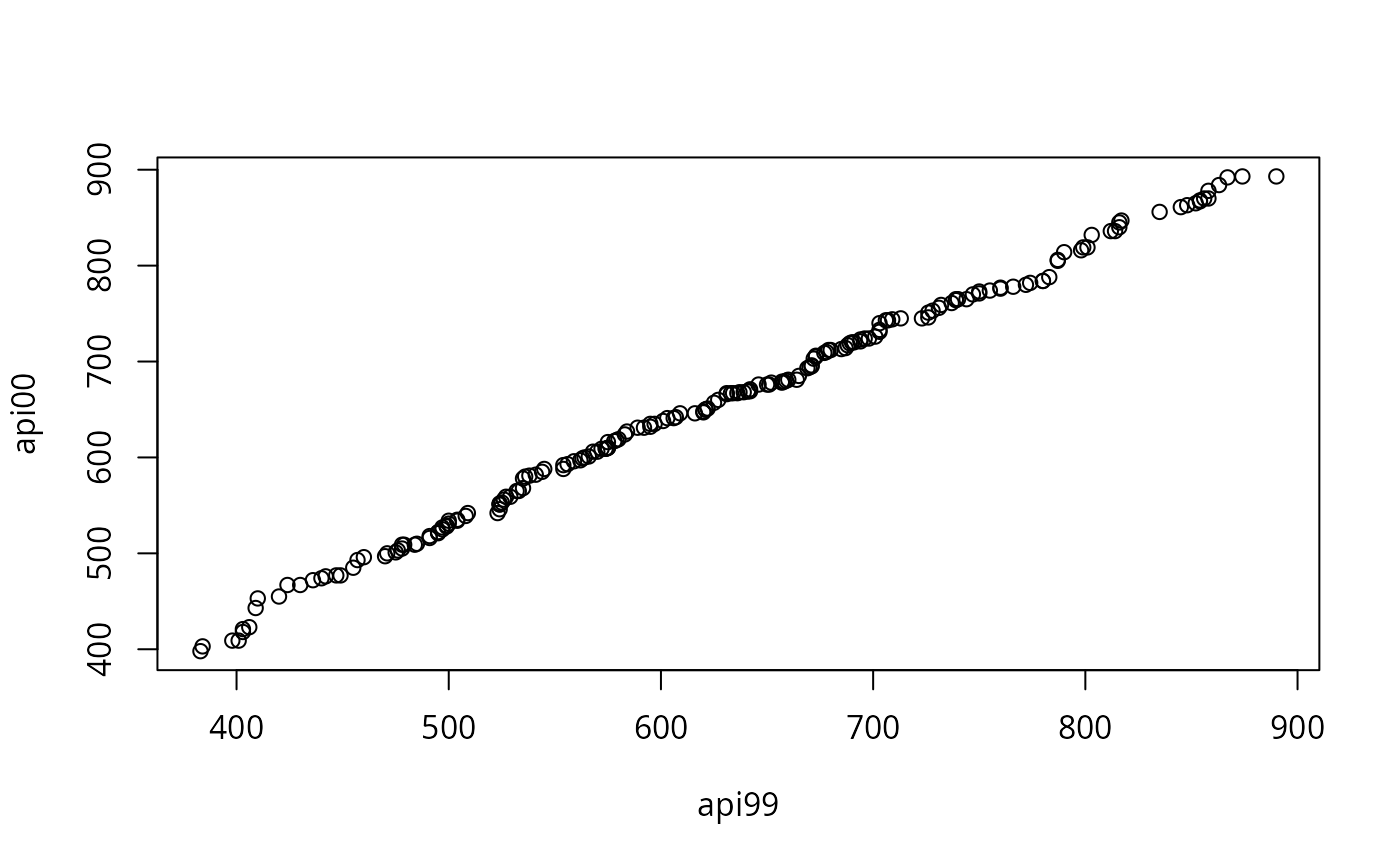
 svyqqplot(api00~api99, design=dstrat)
 dclus1<-svydesign(id=~dnum, weights=~pw, data=apiclus1, fpc=~fpc)
opar<-par(mfrow=c(1,2))
## sample distributions very different
qqplot(apiclus1$enroll, apistrat$enroll); abline(0,1)
## estimated population distributions much more similar
svyqqplot(enroll~enroll, design=dstrat,designx=dclus1,qrule=survey:::qrule_hf8); abline(0,1)
dclus1<-svydesign(id=~dnum, weights=~pw, data=apiclus1, fpc=~fpc)
opar<-par(mfrow=c(1,2))
## sample distributions very different
qqplot(apiclus1$enroll, apistrat$enroll); abline(0,1)
## estimated population distributions much more similar
svyqqplot(enroll~enroll, design=dstrat,designx=dclus1,qrule=survey:::qrule_hf8); abline(0,1)
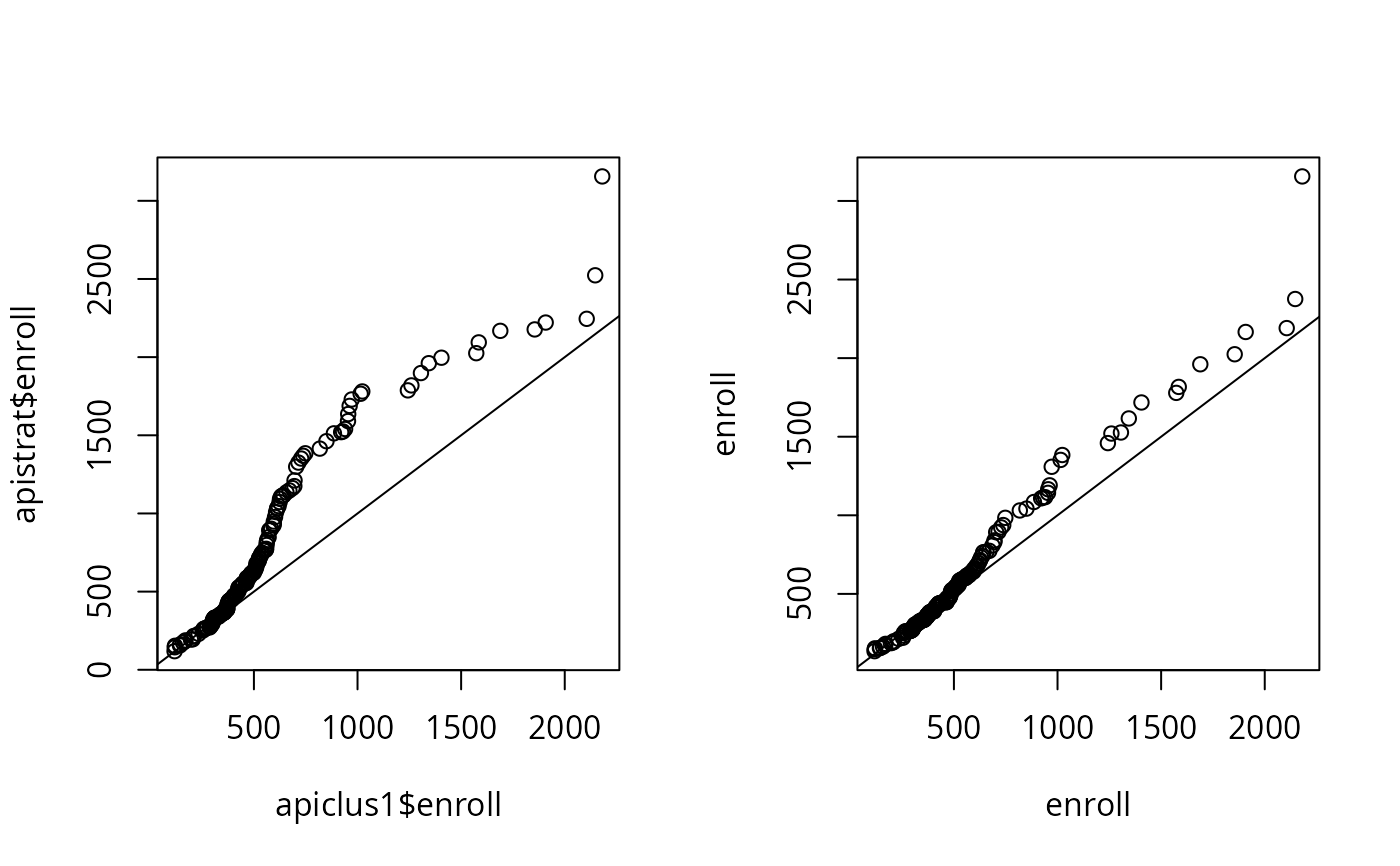 par(opar)