Sampling-weighted principal component analysis
svyprcomp.RdComputes principal components using the sampling weights.
Usage
svyprcomp(formula, design, center = TRUE, scale. = FALSE, tol = NULL, scores = FALSE, ...)
# S3 method for class 'svyprcomp'
biplot(x, cols=c("black","darkred"),xlabs=NULL,
   weight=c("transparent","scaled","none"),
  max.alpha=0.5,max.cex=0.5,xlim=NULL,ylim=NULL,pc.biplot=FALSE,
  expand=1,xlab=NULL,ylab=NULL, arrow.len=0.1, ...)
Arguments
- formula
model formula describing variables to be used
- design
survey design object.
- center
Center data before analysis?
- scale.
Scale to unit variance before analysis?
- tol
Tolerance for omitting components from the results; a proportion of the standard deviation of the first component. The default is to keep all components.
- scores
Return scores on each component? These are needed for
biplot.- x
A
svyprcompobject- cols
Base colors for observations and variables respectively
- xlabs
Formula, or character vector, giving labels for each observation
- weight
How to display the sampling weights:
"scaled"changes the size of the point label,"transparent"uses opacity proportional to sampling weight,"none"changes neither.- max.alpha
Opacity for the largest sampling weight, or for all points if
weight!="transparent"- max.cex
Character size (as a multiple of
par("cex")) for the largest sampling weight, or for all points ifweight!="scaled"- xlim,ylim,xlab,ylab
Graphical parameters
- expand,arrow.len
See
biplot- pc.biplot
See
link{biplot.prcomp}- ...
Other arguments to
prcomp, or graphical parameters forbiplot
Value
svyprcomp returns an object of class svyprcomp, similar to
class prcomp but including design information
Examples
data(api)
dclus2<-svydesign(id=~dnum+snum, fpc=~fpc1+fpc2, data=apiclus2)
pc <- svyprcomp(~api99+api00+ell+hsg+meals+emer, design=dclus2,scale=TRUE,scores=TRUE)
pc
#> Standard deviations (1, .., p=6):
#> [1] 2.00614662 1.06784643 0.72819673 0.51593850 0.18862407 0.05511512
#>
#> Rotation (n x k) = (6 x 6):
#> PC1 PC2 PC3 PC4 PC5 PC6
#> api99 0.3831145 -0.5943589 0.08306768 0.06979896 -0.022302291 -0.69834894
#> api00 0.3934925 -0.5718779 0.03836692 0.07704907 0.008208835 0.71459312
#> ell 0.4493746 0.2056601 -0.25640658 -0.58763687 -0.587114958 0.00100877
#> hsg 0.4089487 0.3506756 -0.21317497 0.77628465 -0.248055264 -0.01395416
#> meals 0.4594419 0.2384659 -0.32112577 -0.19296434 0.768508662 -0.03293318
#> emer 0.3436909 0.3123423 0.88165644 -0.06341416 0.050933992 0.01962417
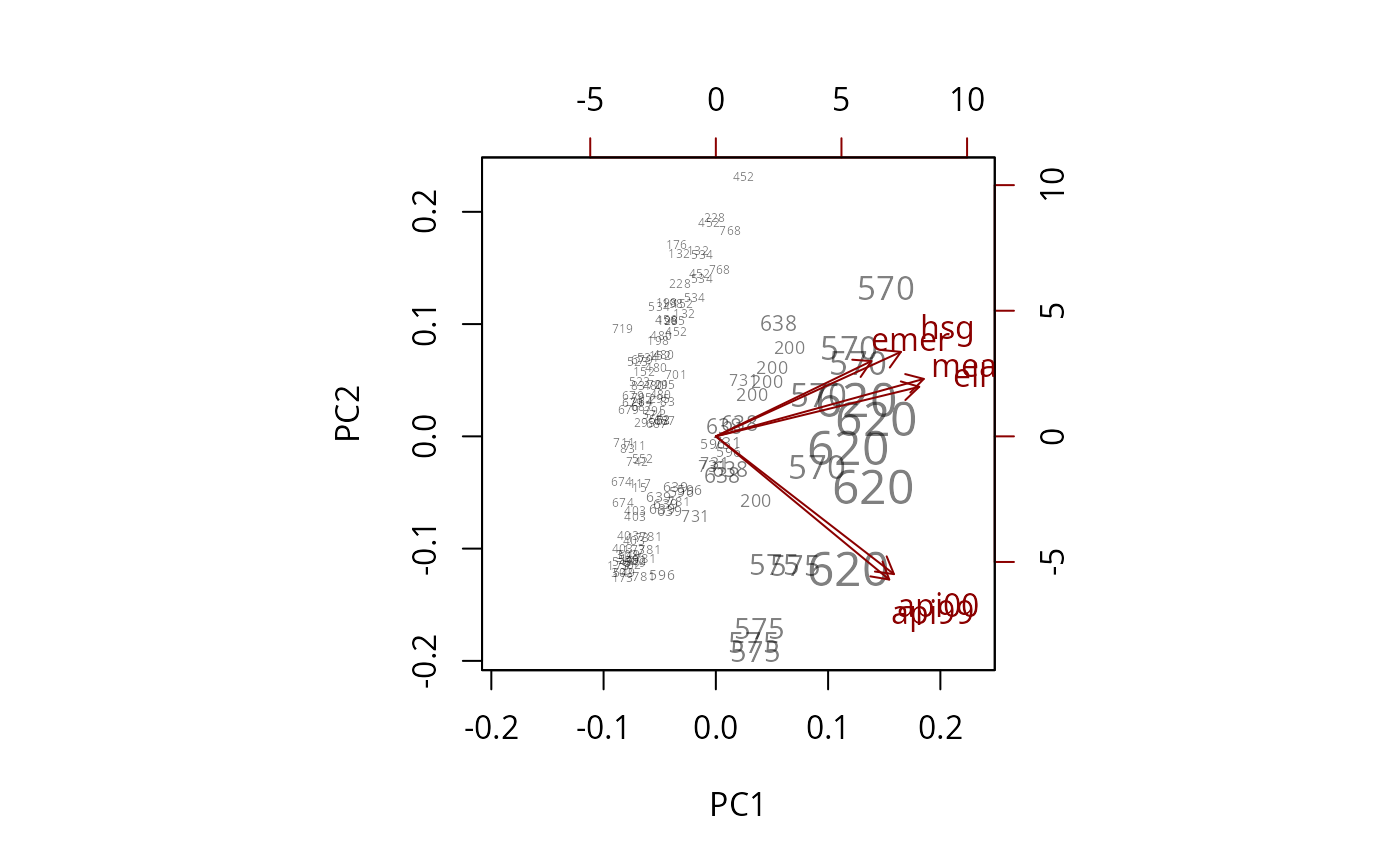
biplot(pc, xlabs=~dnum, weight="none")
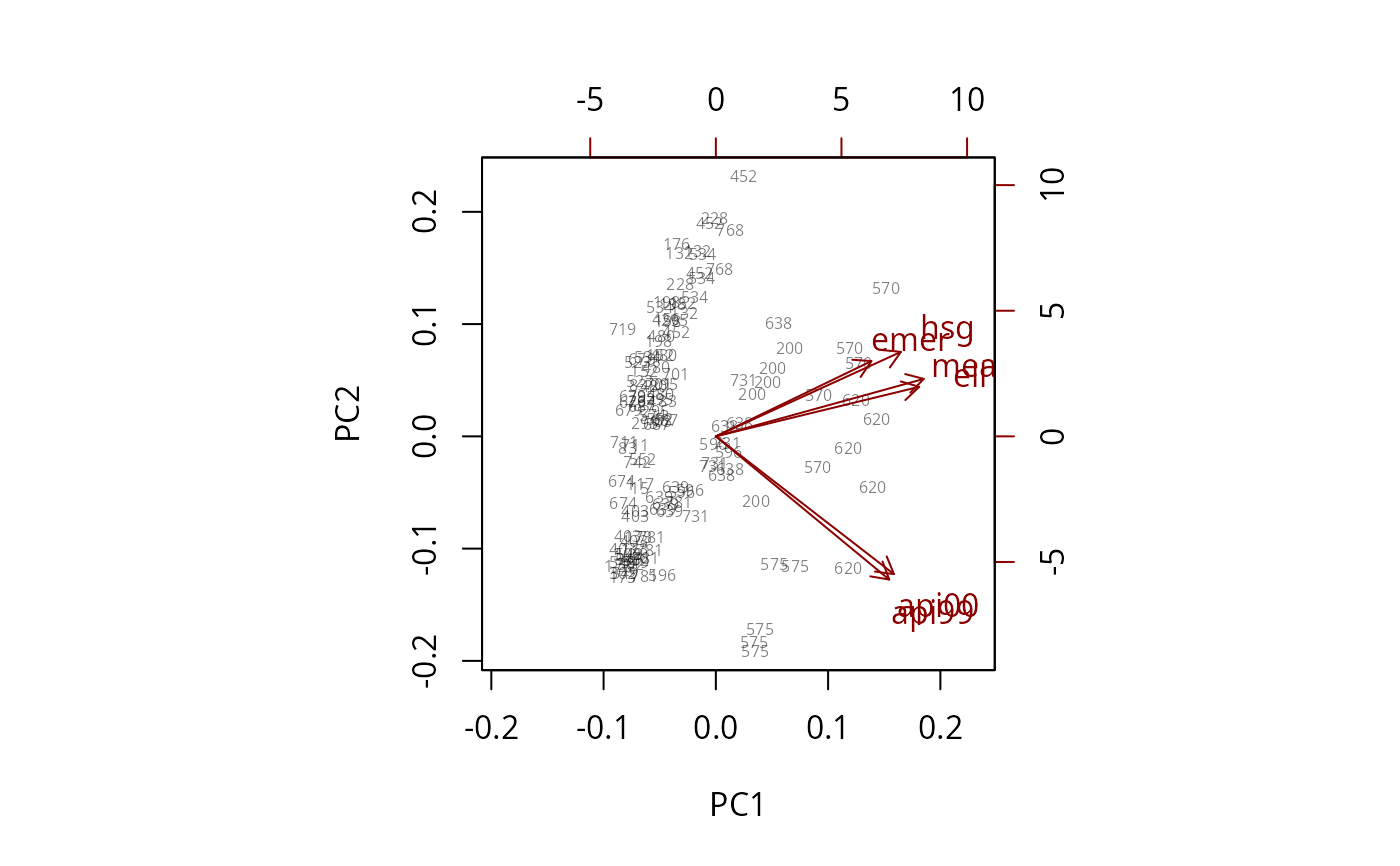 biplot(pc, xlabs=~dnum,max.alpha=1)
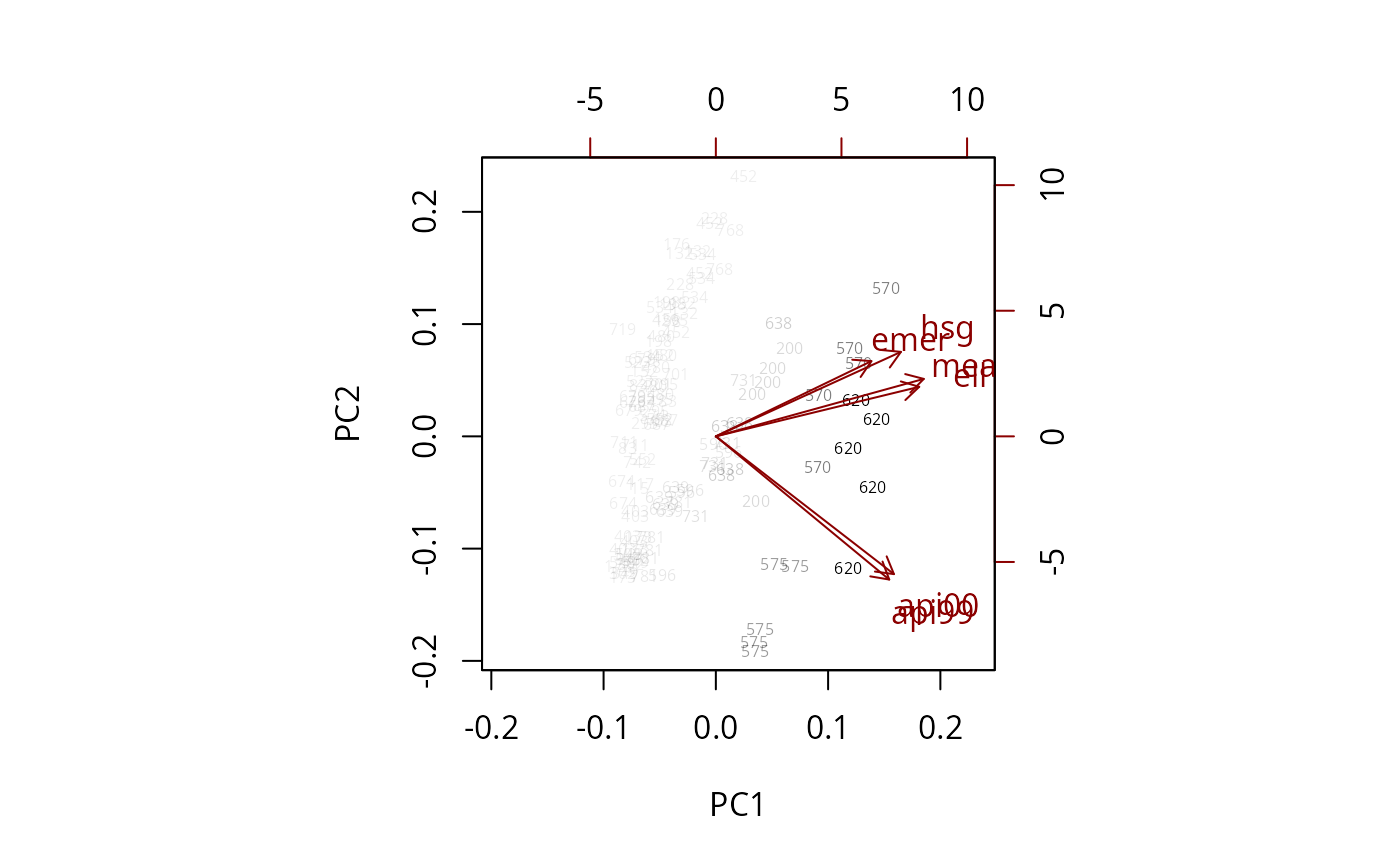 biplot(pc, weight="scaled",max.cex=1.5, xlabs=~dnum)