Barplots and Dotplots
barplot.svystat.RdDraws a barplot or dotplot based on results from a survey analysis. The default
barplot method already works for results from svytable.
Usage
# S3 method for class 'svystat'
barplot(height, ...)
# S3 method for class 'svrepstat'
barplot(height, ...)
# S3 method for class 'svyby'
barplot(height,beside=TRUE, ...)

# S3 method for class 'svystat'
dotchart(x,...,pch=19)
# S3 method for class 'svrepstat'
dotchart(x,...,pch=19)
# S3 method for class 'svyby'
dotchart(x,...,pch=19)
Arguments
- height,x
Analysis result
- beside
Grouped, rather than stacked, bars
- ...
Arguments to
barplotordotchart- pch
Overrides the default in
dotchart.default
Examples
data(api)
dclus1<-svydesign(id=~dnum, weights=~pw, data=apiclus1, fpc=~fpc)
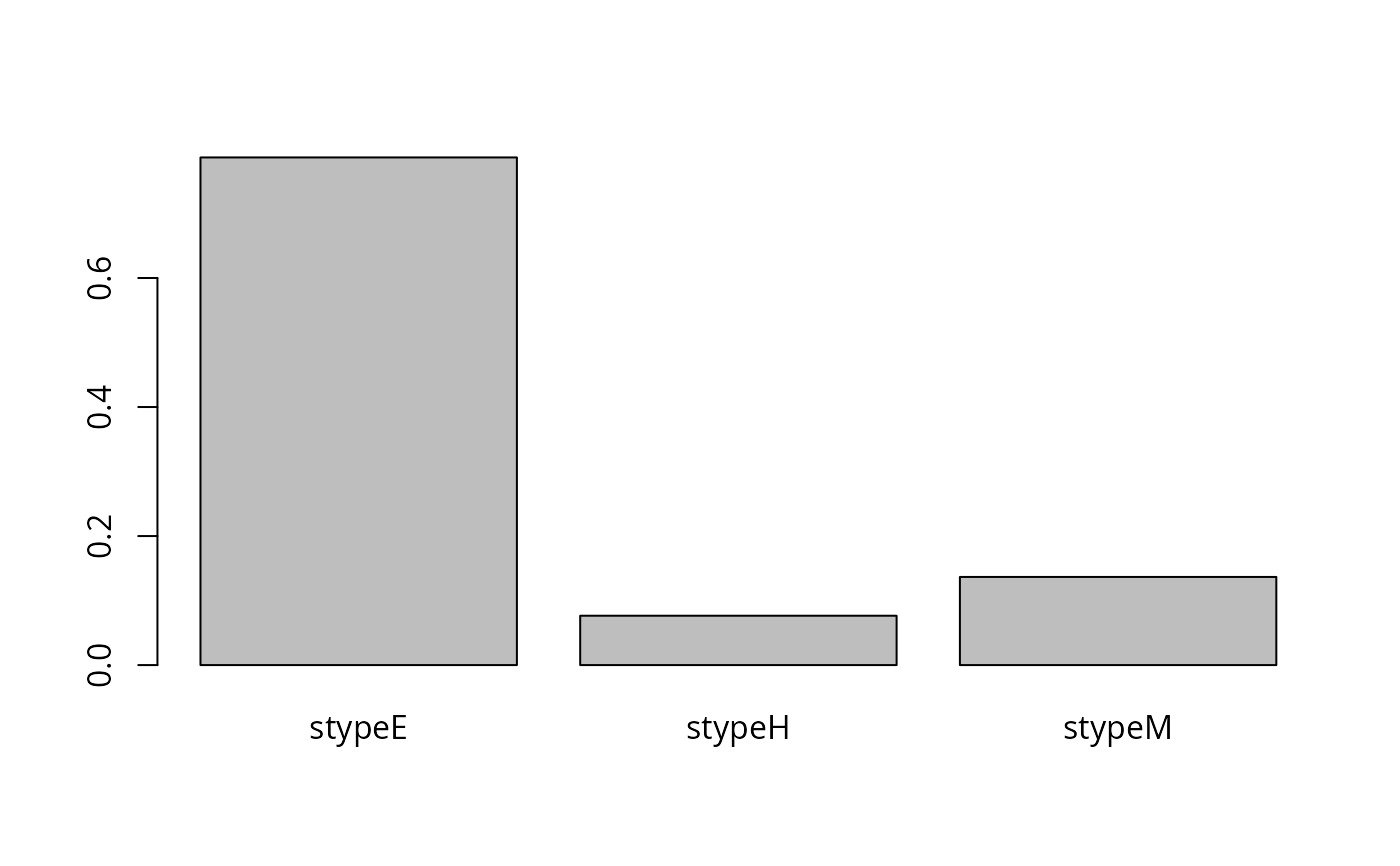
a<-svymean(~stype, dclus1)
barplot(a)
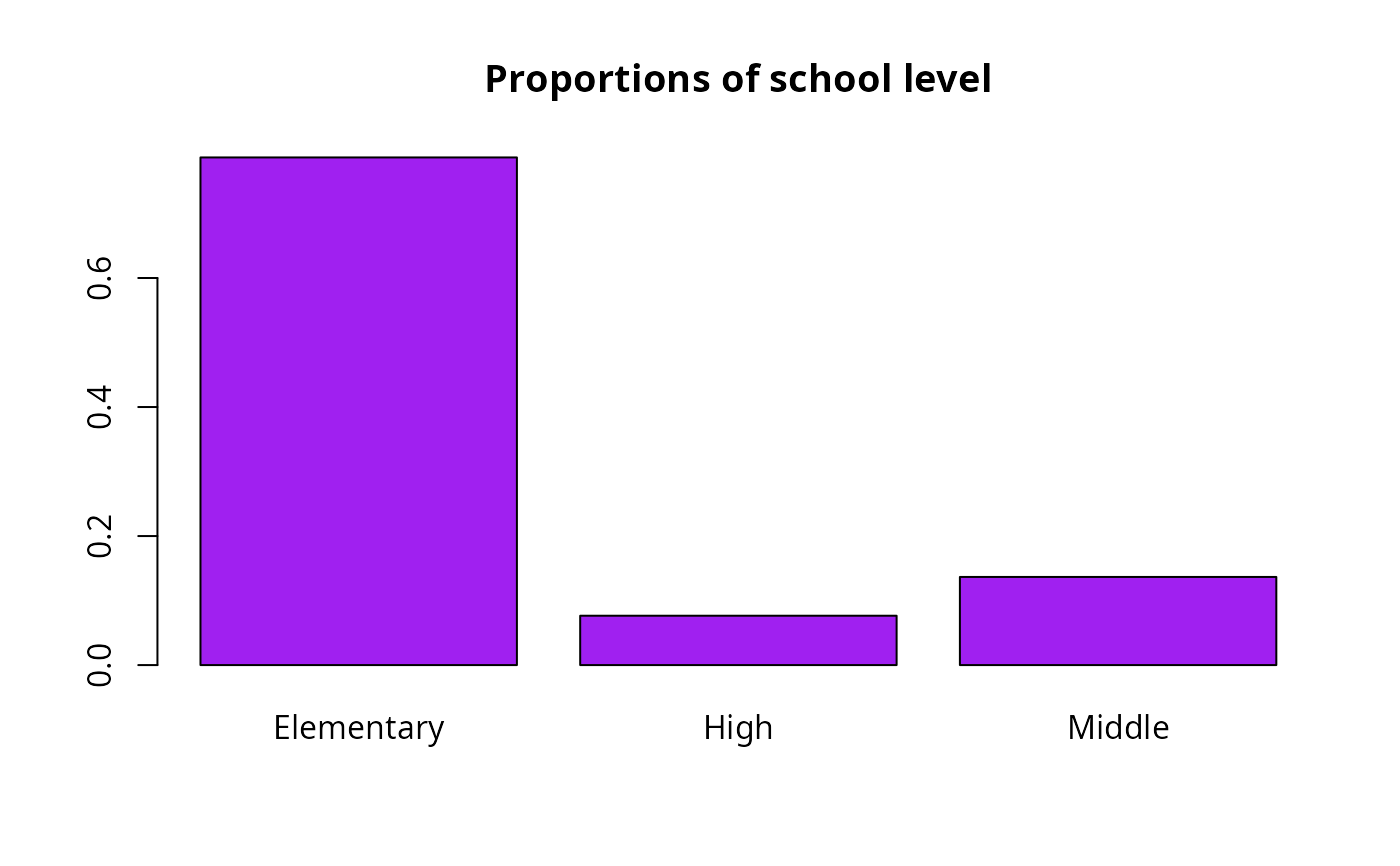
 barplot(a, names.arg=c("Elementary","High","Middle"), col="purple",
main="Proportions of school level")
barplot(a, names.arg=c("Elementary","High","Middle"), col="purple",
main="Proportions of school level")
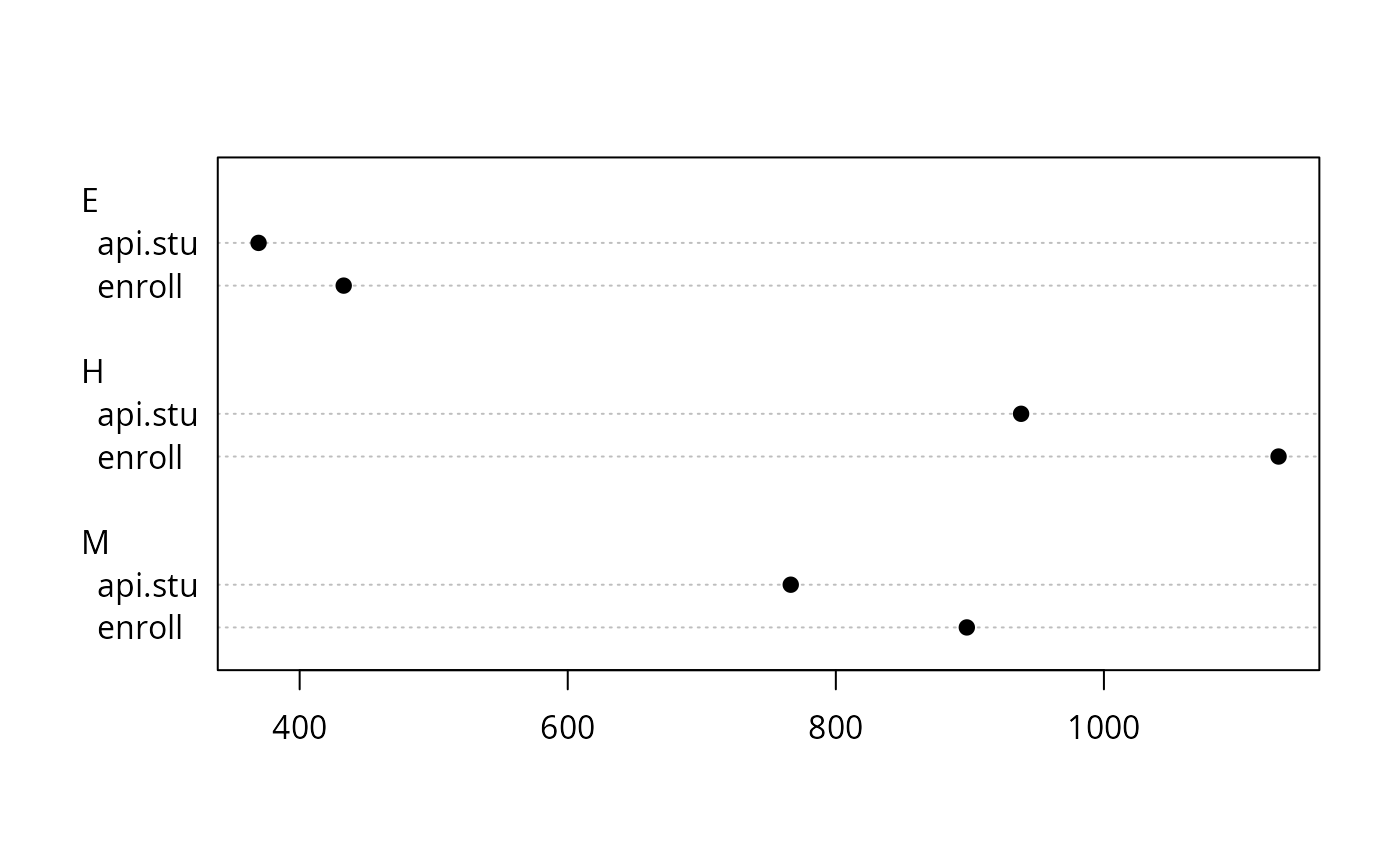
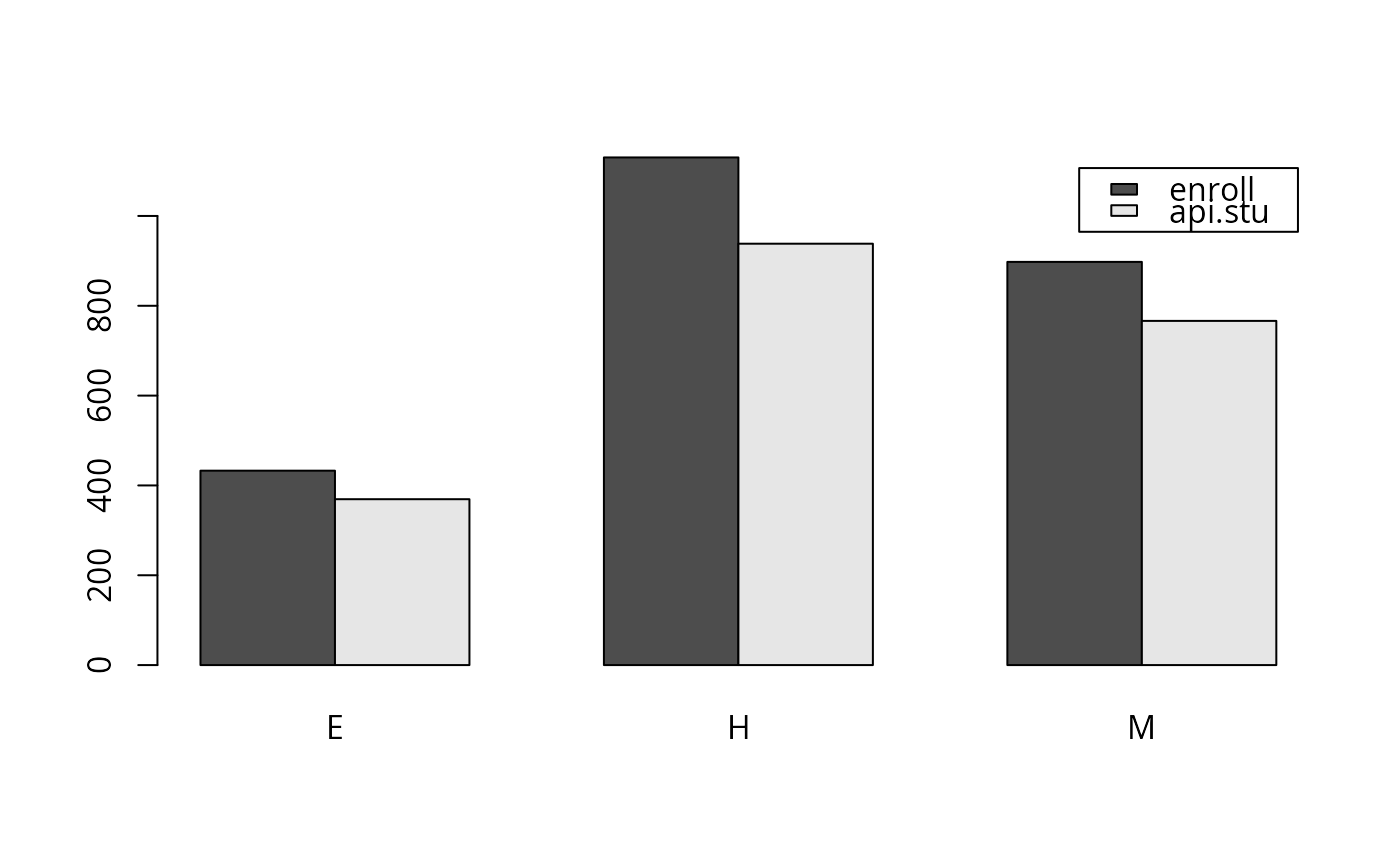
 b<-svyby(~enroll+api.stu, ~stype, dclus1, svymean)
barplot(b,beside=TRUE,legend=TRUE)
b<-svyby(~enroll+api.stu, ~stype, dclus1, svymean)
barplot(b,beside=TRUE,legend=TRUE)
 dotchart(b)