create objects of class SpatialMultiPoints or SpatialMultiPointsDataFrame
SpatialMultiPoints.Rdcreate objects of class SpatialMultiPoints-class or
SpatialMultiPointsDataFrame-class from
coordinates, and from coordinates and data.frames
Usage
SpatialMultiPoints(coords, proj4string=CRS(as.character(NA)), bbox = NULL)
SpatialMultiPointsDataFrame(coords, data,
      proj4string = CRS(as.character(NA)), match.ID, bbox = NULL)
Arguments
- coords
list with in each element a numeric matrix or data.frame with coordinates (each row representing a point); in case of SpatialMultiPointsDataFrame an object of class SpatialMultiPoints-class is also allowed
- proj4string
projection string of class CRS-class
- bbox
bounding box matrix, usually NULL and constructed from the data, but may be passed through for coercion purposes if clearly needed
- data
object of class
data.frame; the number of rows indatashould equal the number of points in thecoordsobject- match.ID
logical or character; if missing, and
coordsanddataboth have row names, and their order does not correspond, matching is done by these row names and a warning is issued; this warning can be suppressed by settingmatch.IDto TRUE. If TRUE AND coords has non-automatic rownames (i.e., coerced to a matrix byas.matrix,dimnames(coords)[[1]]is notNULL), ANDdatahas row.names (i.e. is a data.frame), then theSpatialMultiPointsDataFrameobject is formed by matching the row names of both components, leaving the order of the coordinates in tact. Checks are done to see whether both row names are sufficiently unique, and all data are matched. If FALSE, coordinates and data are simply "glued" together, ignoring row names. If character: indicates the column indatawith coordinates IDs to use for matching records. See examples below.
Value
SpatialMultiPoints returns an object of class SpatialMultiPoints;
SpatialMultiPointsDataFrame returns an object of class SpatialMultiPointsDataFrame;
Examples
cl1 = cbind(rnorm(3, 10), rnorm(3, 10))
cl2 = cbind(rnorm(5, 10), rnorm(5, 0))
cl3 = cbind(rnorm(7, 0), rnorm(7, 10))
mp = SpatialMultiPoints(list(cl1, cl2, cl3))
mpx = rbind(mp, mp) # rbind method
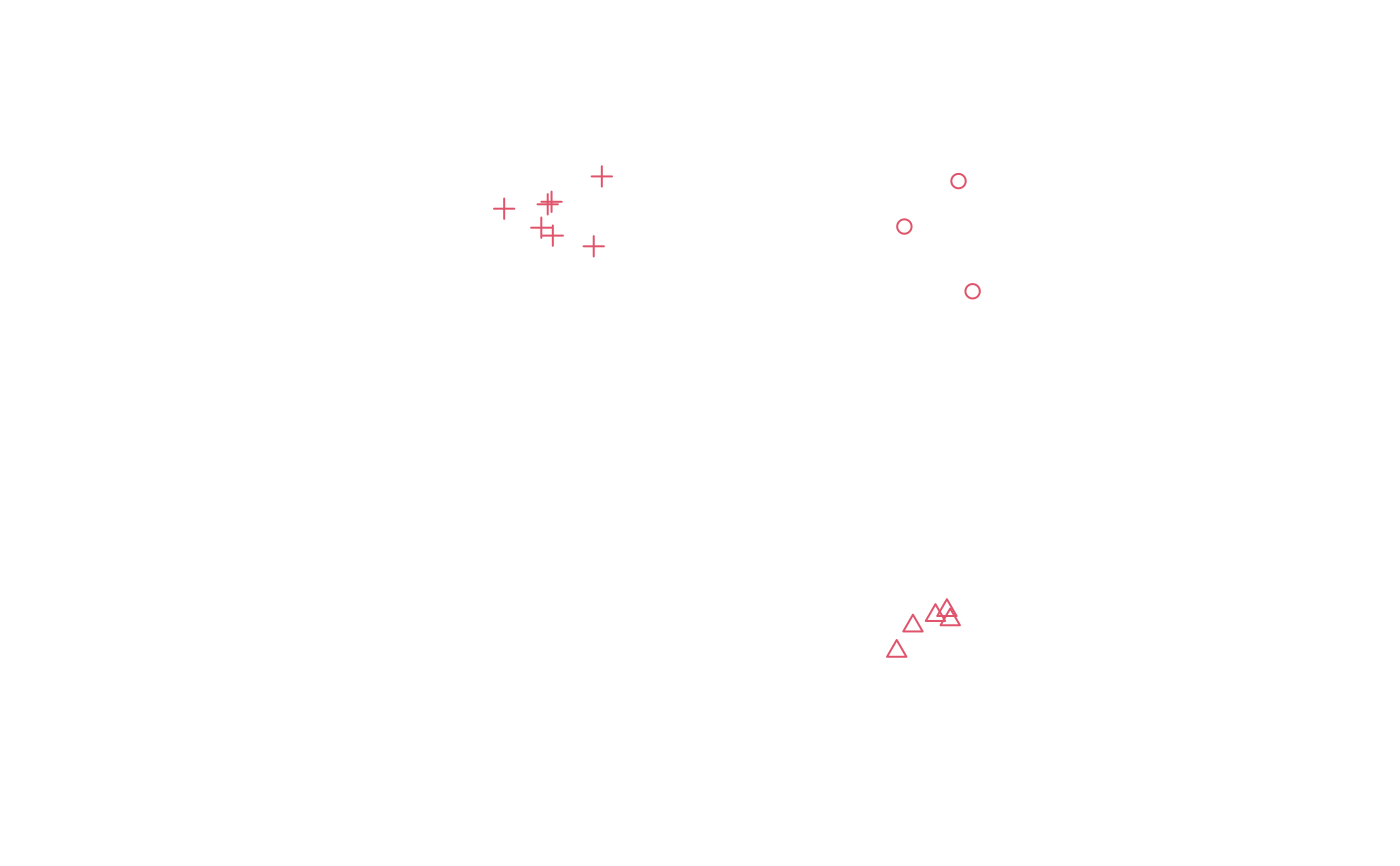
plot(mp, col = 2, cex = 1, pch = 1:3)
 mp
#> SpatialMultiPoints:
#> [[1]]
#> [,1] [,2]
#> [1,] 10.990458 11.037635
#> [2,] 9.524533 9.806764
#> [3,] 11.372238 8.054232
#>
#> [[2]]
#> [,1] [,2]
#> [1,] 10.766155 -0.8376508
#> [2,] 9.756940 -1.0049490
#> [3,] 9.317356 -1.6903584
#> [4,] 10.365844 -0.7211439
#> [5,] 10.676177 -0.5866481
#>
#> [[3]]
#> [,1] [,2]
#> [1,] -0.028602569 10.477307
#> [2,] -1.310973740 10.289963
#> [3,] 0.006060172 9.561015
#> [4,] 1.113566608 9.271680
#> [5,] 1.332774427 11.163527
#> [6,] -0.132455469 10.409158
#> [7,] -0.305739028 9.775527
#>
#> Coordinate Reference System (CRS) arguments: NA
mp[1:2]
#> SpatialMultiPoints:
#> [[1]]
#> [,1] [,2]
#> [1,] 10.990458 11.037635
#> [2,] 9.524533 9.806764
#> [3,] 11.372238 8.054232
#>
#> [[2]]
#> [,1] [,2]
#> [1,] 10.766155 -0.8376508
#> [2,] 9.756940 -1.0049490
#> [3,] 9.317356 -1.6903584
#> [4,] 10.365844 -0.7211439
#> [5,] 10.676177 -0.5866481
#>
#> Coordinate Reference System (CRS) arguments: NA
print(mp, asWKT=TRUE, digits=3)
#> SpatialMultiPoints:
#> geometry
#> 1 MULTIPOINT (11 11,9.52 9.81,11.4 8.05)
#> 2 MULTIPOINT (10.8 -0.838,9.76 -1,9.32 -1.69,10.4 -0.721,10.7 -0.587)
#> 3 MULTIPOINT (-0.0286 10.5,-1.31 10.3,0.00606 9.56,1.11 9.27,1.33 11.2,-0.132 10.4,-0.306 9.78)
#> Coordinate Reference System (CRS) arguments: NA
mpdf = SpatialMultiPointsDataFrame(list(cl1, cl2, cl3), data.frame(a = 1:3))
mpdf
#> coordinates a
#> 1 (10.99046, 11.03763) 1
#> 1.1 (9.524533, 9.806764) 1
#> 1.2 (11.37224, 8.054232) 1
#> 2 (10.76616, -0.8376508) 2
#> 2.1 (9.75694, -1.004949) 2
#> 2.2 (9.317356, -1.690358) 2
#> 2.3 (10.36584, -0.7211439) 2
#> 2.4 (10.67618, -0.5866481) 2
#> 3 (-0.02860257, 10.47731) 3
#> 3.1 (-1.310974, 10.28996) 3
#> 3.2 (0.006060172, 9.561015) 3
#> 3.3 (1.113567, 9.27168) 3
#> 3.4 (1.332774, 11.16353) 3
#> 3.5 (-0.1324555, 10.40916) 3
#> 3.6 (-0.305739, 9.775527) 3
mpdfx = rbind(mpdf, mpdf) # rbind method
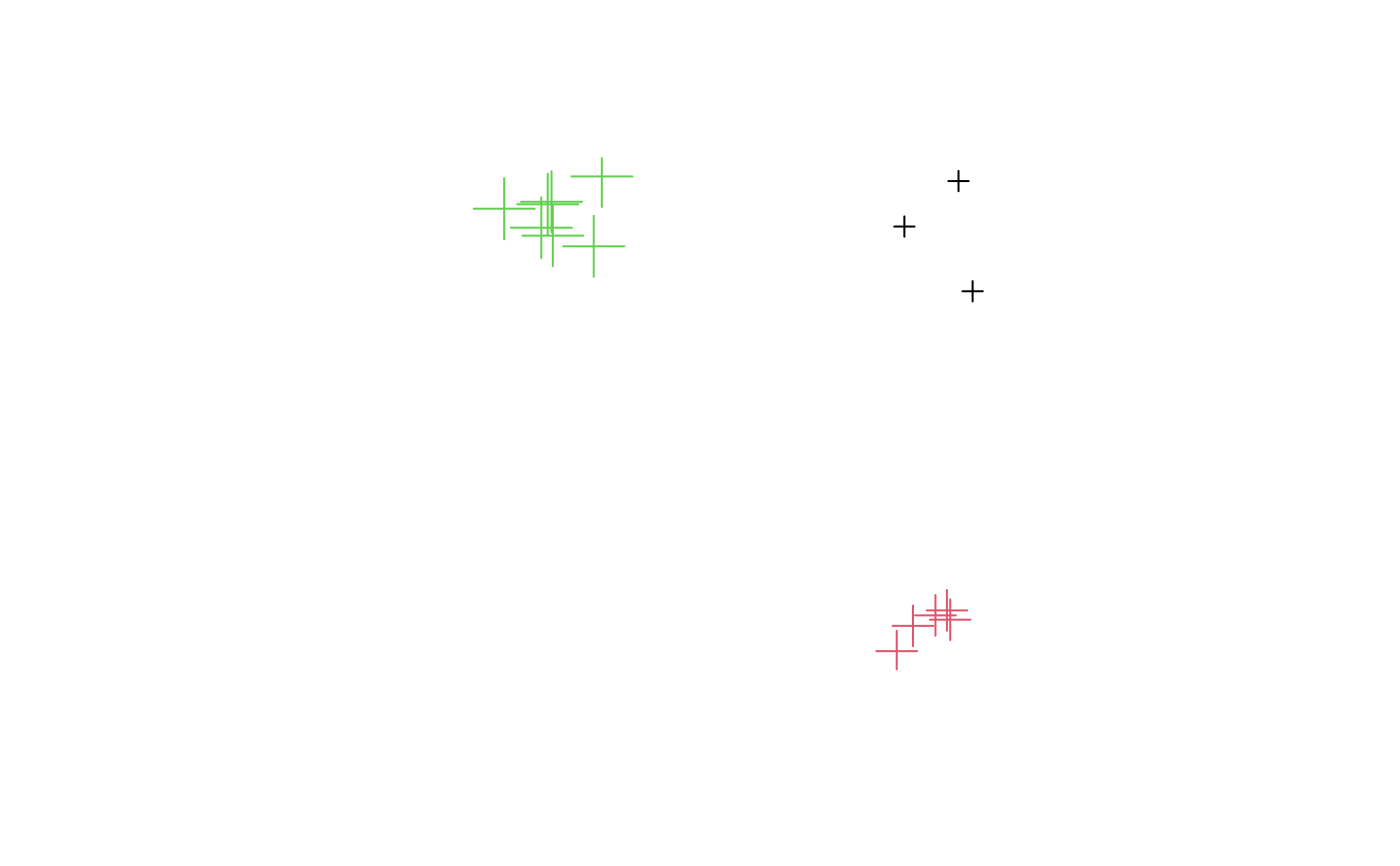
plot(mpdf, col = mpdf$a, cex = 1:3)
mp
#> SpatialMultiPoints:
#> [[1]]
#> [,1] [,2]
#> [1,] 10.990458 11.037635
#> [2,] 9.524533 9.806764
#> [3,] 11.372238 8.054232
#>
#> [[2]]
#> [,1] [,2]
#> [1,] 10.766155 -0.8376508
#> [2,] 9.756940 -1.0049490
#> [3,] 9.317356 -1.6903584
#> [4,] 10.365844 -0.7211439
#> [5,] 10.676177 -0.5866481
#>
#> [[3]]
#> [,1] [,2]
#> [1,] -0.028602569 10.477307
#> [2,] -1.310973740 10.289963
#> [3,] 0.006060172 9.561015
#> [4,] 1.113566608 9.271680
#> [5,] 1.332774427 11.163527
#> [6,] -0.132455469 10.409158
#> [7,] -0.305739028 9.775527
#>
#> Coordinate Reference System (CRS) arguments: NA
mp[1:2]
#> SpatialMultiPoints:
#> [[1]]
#> [,1] [,2]
#> [1,] 10.990458 11.037635
#> [2,] 9.524533 9.806764
#> [3,] 11.372238 8.054232
#>
#> [[2]]
#> [,1] [,2]
#> [1,] 10.766155 -0.8376508
#> [2,] 9.756940 -1.0049490
#> [3,] 9.317356 -1.6903584
#> [4,] 10.365844 -0.7211439
#> [5,] 10.676177 -0.5866481
#>
#> Coordinate Reference System (CRS) arguments: NA
print(mp, asWKT=TRUE, digits=3)
#> SpatialMultiPoints:
#> geometry
#> 1 MULTIPOINT (11 11,9.52 9.81,11.4 8.05)
#> 2 MULTIPOINT (10.8 -0.838,9.76 -1,9.32 -1.69,10.4 -0.721,10.7 -0.587)
#> 3 MULTIPOINT (-0.0286 10.5,-1.31 10.3,0.00606 9.56,1.11 9.27,1.33 11.2,-0.132 10.4,-0.306 9.78)
#> Coordinate Reference System (CRS) arguments: NA
mpdf = SpatialMultiPointsDataFrame(list(cl1, cl2, cl3), data.frame(a = 1:3))
mpdf
#> coordinates a
#> 1 (10.99046, 11.03763) 1
#> 1.1 (9.524533, 9.806764) 1
#> 1.2 (11.37224, 8.054232) 1
#> 2 (10.76616, -0.8376508) 2
#> 2.1 (9.75694, -1.004949) 2
#> 2.2 (9.317356, -1.690358) 2
#> 2.3 (10.36584, -0.7211439) 2
#> 2.4 (10.67618, -0.5866481) 2
#> 3 (-0.02860257, 10.47731) 3
#> 3.1 (-1.310974, 10.28996) 3
#> 3.2 (0.006060172, 9.561015) 3
#> 3.3 (1.113567, 9.27168) 3
#> 3.4 (1.332774, 11.16353) 3
#> 3.5 (-0.1324555, 10.40916) 3
#> 3.6 (-0.305739, 9.775527) 3
mpdfx = rbind(mpdf, mpdf) # rbind method
plot(mpdf, col = mpdf$a, cex = 1:3)
 as(mpdf, "data.frame")
#> X1 X2 index a
#> X1 10.990458223 11.0376347 1 1
#> X1.1 9.524533289 9.8067644 1 1
#> X1.2 11.372237898 8.0542317 1 1
#> X2 10.766155367 -0.8376508 2 2
#> X2.1 9.756940303 -1.0049490 2 2
#> X2.2 9.317356098 -1.6903584 2 2
#> X2.3 10.365844013 -0.7211439 2 2
#> X2.4 10.676177234 -0.5866481 2 2
#> X3 -0.028602569 10.4773073 3 3
#> X3.1 -1.310973740 10.2899630 3 3
#> X3.2 0.006060172 9.5610153 3 3
#> X3.3 1.113566608 9.2716802 3 3
#> X3.4 1.332774427 11.1635273 3 3
#> X3.5 -0.132455469 10.4091582 3 3
#> X3.6 -0.305739028 9.7755275 3 3
mpdf[1:2,]
#> coordinates a
#> 1 (10.99046, 11.03763) 1
#> 1.1 (9.524533, 9.806764) 1
#> 1.2 (11.37224, 8.054232) 1
#> 2 (10.76616, -0.8376508) 2
#> 2.1 (9.75694, -1.004949) 2
#> 2.2 (9.317356, -1.690358) 2
#> 2.3 (10.36584, -0.7211439) 2
#> 2.4 (10.67618, -0.5866481) 2
as(mpdf, "data.frame")
#> X1 X2 index a
#> X1 10.990458223 11.0376347 1 1
#> X1.1 9.524533289 9.8067644 1 1
#> X1.2 11.372237898 8.0542317 1 1
#> X2 10.766155367 -0.8376508 2 2
#> X2.1 9.756940303 -1.0049490 2 2
#> X2.2 9.317356098 -1.6903584 2 2
#> X2.3 10.365844013 -0.7211439 2 2
#> X2.4 10.676177234 -0.5866481 2 2
#> X3 -0.028602569 10.4773073 3 3
#> X3.1 -1.310973740 10.2899630 3 3
#> X3.2 0.006060172 9.5610153 3 3
#> X3.3 1.113566608 9.2716802 3 3
#> X3.4 1.332774427 11.1635273 3 3
#> X3.5 -0.132455469 10.4091582 3 3
#> X3.6 -0.305739028 9.7755275 3 3
mpdf[1:2,]
#> coordinates a
#> 1 (10.99046, 11.03763) 1
#> 1.1 (9.524533, 9.806764) 1
#> 1.2 (11.37224, 8.054232) 1
#> 2 (10.76616, -0.8376508) 2
#> 2.1 (9.75694, -1.004949) 2
#> 2.2 (9.317356, -1.690358) 2
#> 2.3 (10.36584, -0.7211439) 2
#> 2.4 (10.67618, -0.5866481) 2