adds part of a colored circle to a plot
plotcircle.Rdadds (part of) a colored circle to a plot; an arrow can be drawn at a specified position
plotcircle(r = 1, ...)Arguments
- r
radius of circle.
- ...
arguments passed to function plotellipse.
Details
plotcircle calls plotellipse, making sure that the figure
drawn effectively looks like a circle.
For graphs that have both axes of equal size, the circle will be equal
to the ellipse with equal rx and ry. See second example
see plotellipse for details
See also
plotellipse to draw ellipses
Examples
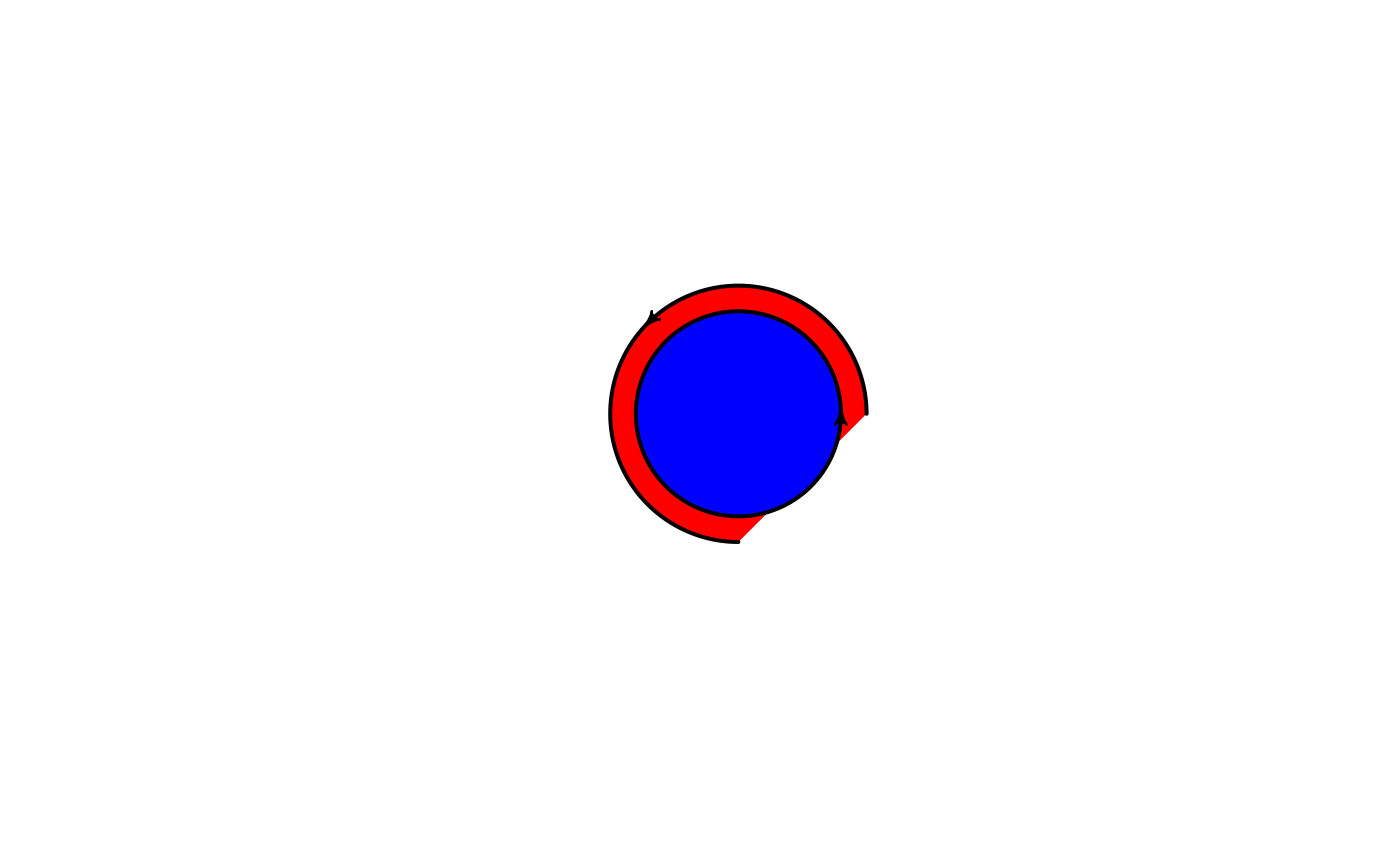
# symmetrical axes
emptyplot(c(0, 1))
plotcircle(mid = c(0.5, 0.5), r = 0.25, from = 0, to = 3*pi/2,
arrow = TRUE, arr.pos = 0.5, col = "red")
# symmetrical
plotellipse(mid = c(0.5, 0.5), rx = 0.2, ry = 0.2,
arrow = TRUE, arr.pos = 0.5, col = "blue")
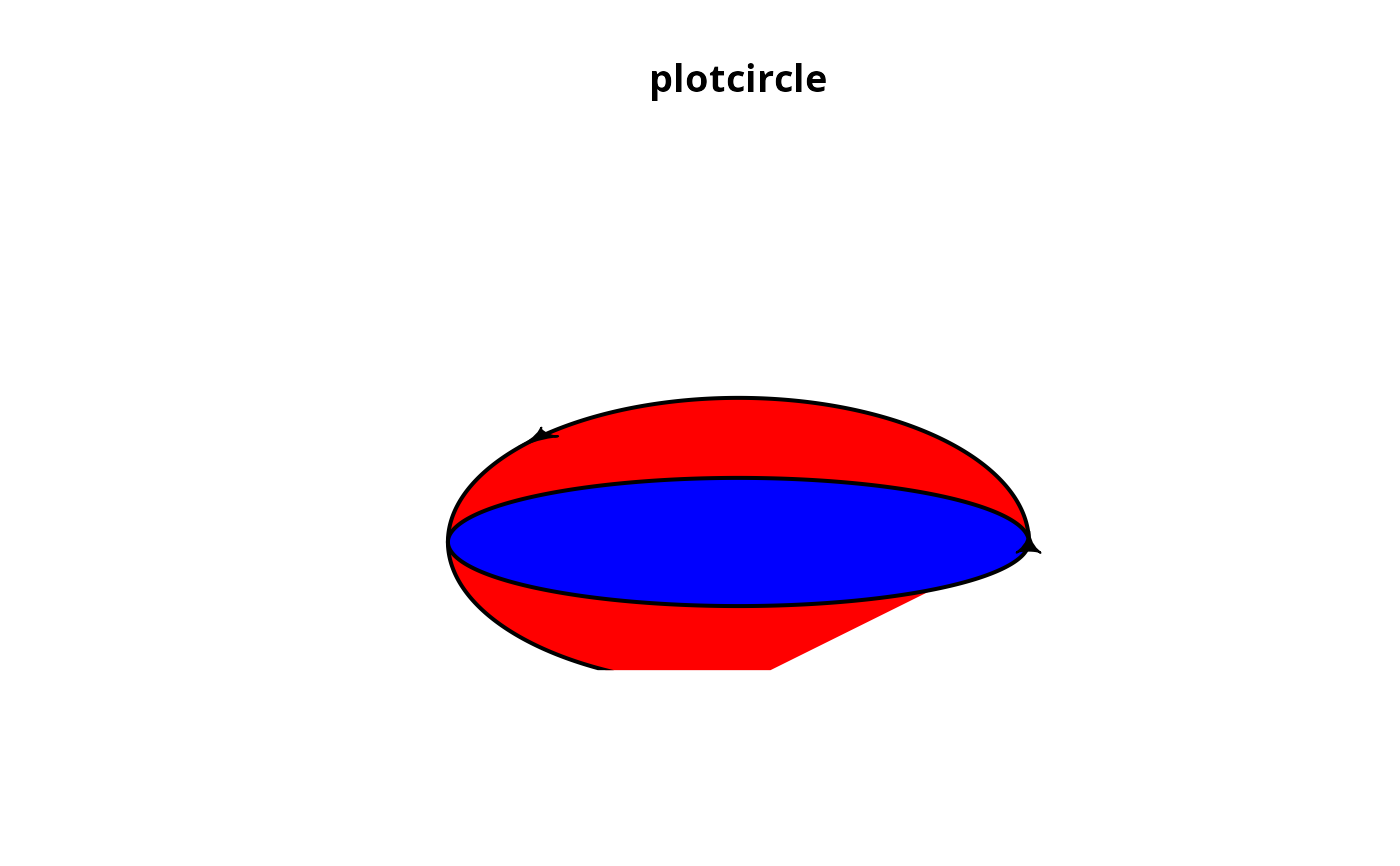
 #non-symmetrical axes
emptyplot(c(0, 1), c(0, 2), main = "plotcircle", asp = FALSE)
plotcircle(mid = c(0.5, 0.5), r = 0.25, from = 0, to = 3*pi/2,
arrow = TRUE, arr.pos = 0.5, col = "red")
plotellipse(mid = c(0.5, 0.5), rx = 0.25, ry = 0.25,
arrow = TRUE, arr.pos = 0.5, col = "blue")
#non-symmetrical axes
emptyplot(c(0, 1), c(0, 2), main = "plotcircle", asp = FALSE)
plotcircle(mid = c(0.5, 0.5), r = 0.25, from = 0, to = 3*pi/2,
arrow = TRUE, arr.pos = 0.5, col = "red")
plotellipse(mid = c(0.5, 0.5), rx = 0.25, ry = 0.25,
arrow = TRUE, arr.pos = 0.5, col = "blue")