adds a color legend to a plot.
colorlegend.RdAdds a color legend to a plot.
Arguments
- col
color palette to be used; also allowed are two extremes or one value.
- zlim
two-valued vector, the minimum and maximum z values.
- zlevels
number of z-levels, one value, ignored if
dzorzvalnot equal toNULL.- dz
increment in legend values, one value; ignored if
zvalnot equal toNULL.- zval
a vector of z-values to label legend.
- log
logical indicating whether to log transform or not.
- posx
relative position of left and right edge of color bar on first axis, [0,1].
- posy
relative position on lower and upper edge of colar bar on second axis, [0,1].
- main
main title, written above the color bar.
- main.cex
relative size of main title.
- main.col
color of main title.
- lab.col
color of labels.
- digit
number of significant digits in labels.
- left
logical indicating whether to put the labels on the right (
TRUE) or on the left (FALSE).- ...
arguments passed to R-function text when writing labels.
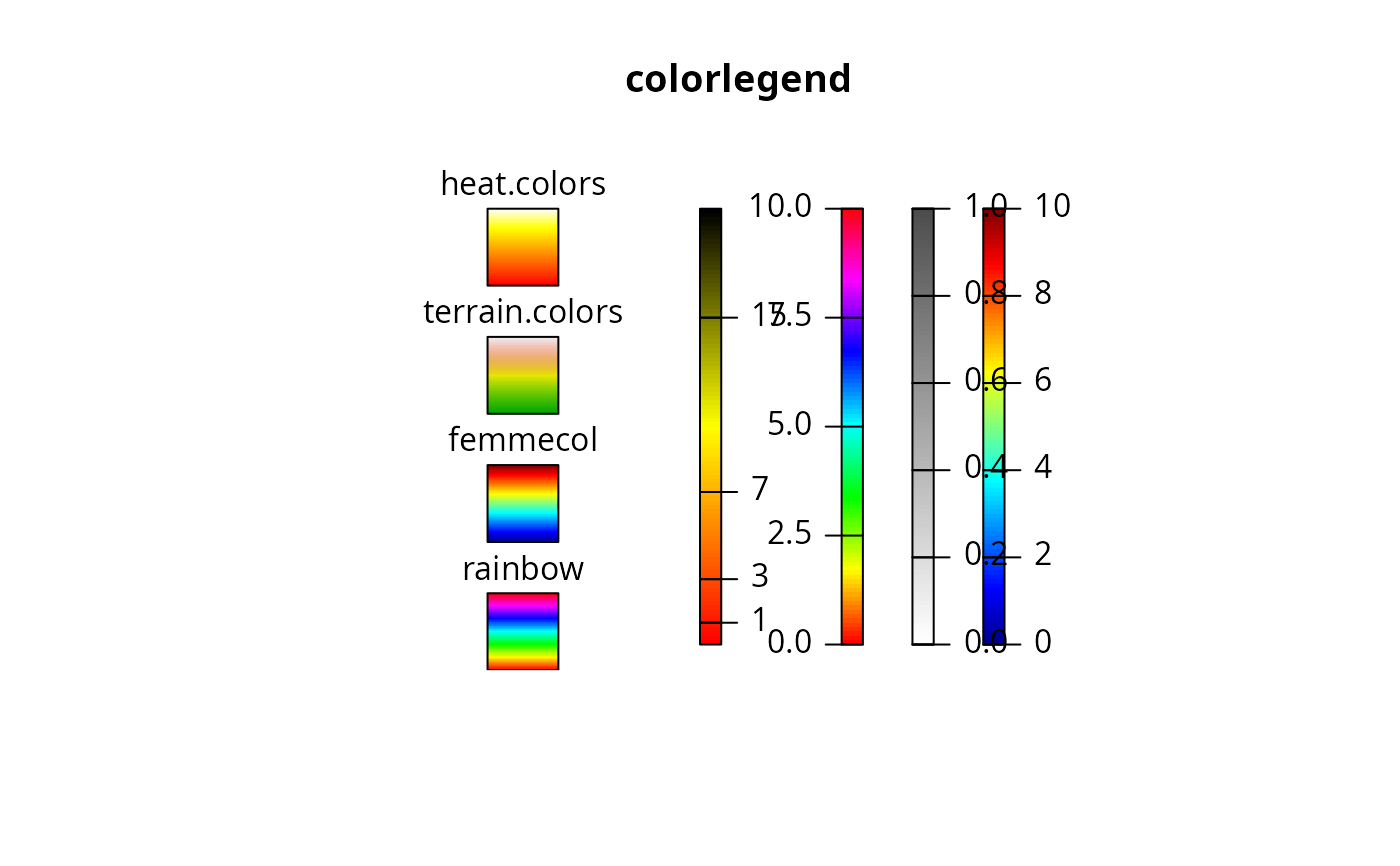
Examples
emptyplot(main = "colorlegend")
colorlegend(zlim = c(0, 10))
colorlegend(posx = c(0.8, 0.83), col = greycol(100),
            zlim = c(0, 1), digit = 1)
colorlegend(posx = c(0.7, 0.73), left = TRUE, col = rainbow(100),
            zlim = c(0, 10), digit = 1, dz = 2.5)
colorlegend(posx = c(0.5, 0.53),
            col = intpalette(c("red", "yellow", "black"), 100),
            zlim = c(0, 20), zval = c(1, 3, 7, 15))
colorlegend(posy = c(0.0, 0.15), posx = c(0.2, 0.3),
            col = rainbow(100), zlim = c(0, 1),
            zlevels = NULL, main = "rainbow")
colorlegend(posy = c(0.25, 0.4), posx = c(0.2, 0.3),
            zlim = c(0, 1), zlevels = NULL, main = "femmecol")
colorlegend(posy = c(0.5, 0.65), posx = c(0.2, 0.3),
            col = terrain.colors(100), zlim = c(0, 1),
            zlevels = NULL, main = "terrain.colors")
colorlegend(posy = c(0.75, 0.9), posx = c(0.2, 0.3),
            col = heat.colors(100), zlim = c(0, 1),
            zlevels = NULL, main = "heat.colors")