This was developed for the R Working Example collection
in my website, pj.freefaculty.org/R/WorkingExamples
Usage
drawnorm(
  mu = 0,
  sigma = 1,
  xlab = "A Normally Distributed Variable",
  ylab = "Probability Density",
  main,
  ps = par("ps"),
  ...
)
Arguments
- mu
The mu parameter
- sigma
The sigma parameter
- xlab
Label for x axis
- ylab
Label for Y axis
- main
Title for plot. OK to ignore this, we'll make a nice one for you
- ps
pointsize of text
- ...
arguments passed to par
Examples
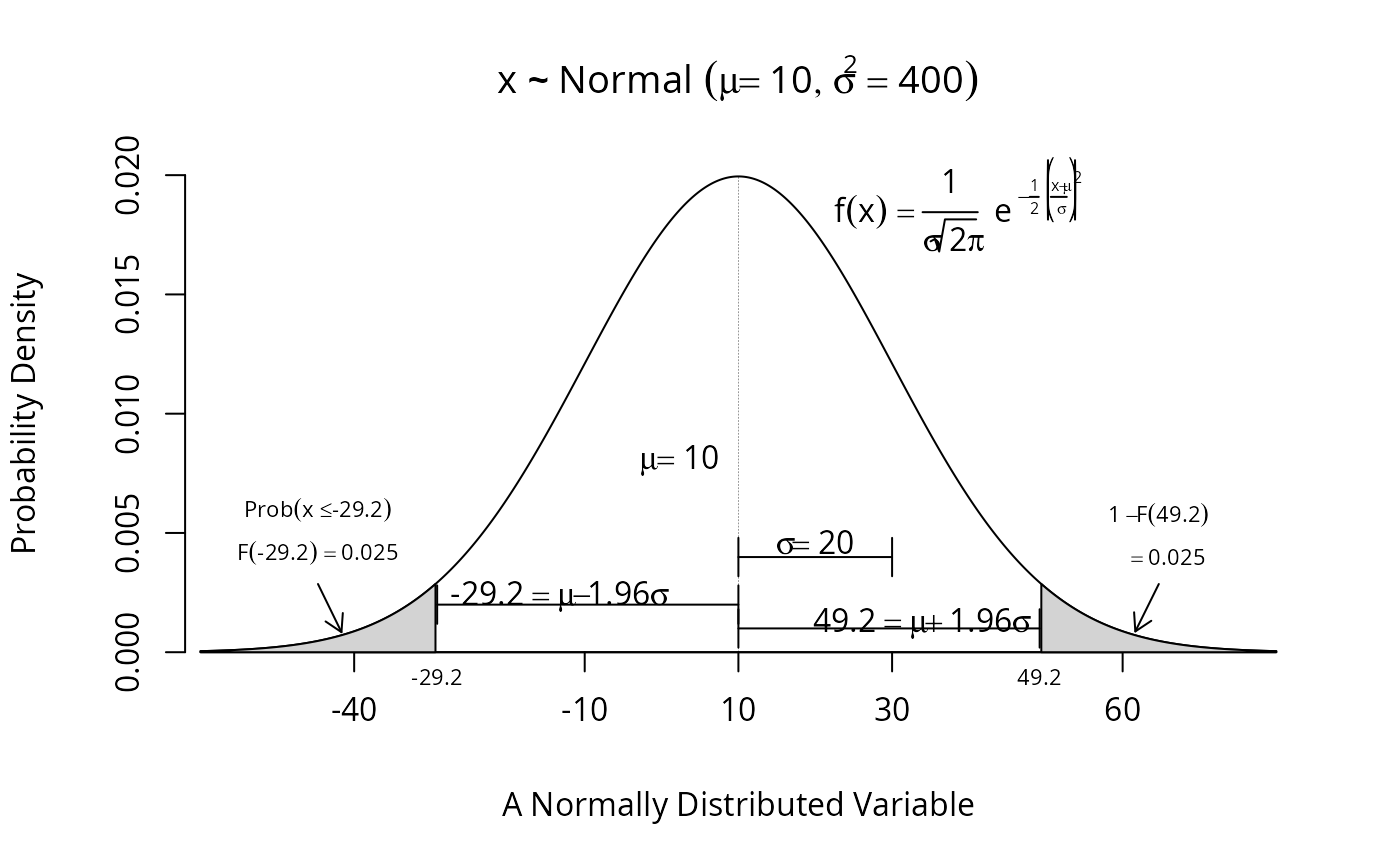
drawnorm(mu = 10, sigma = 20)
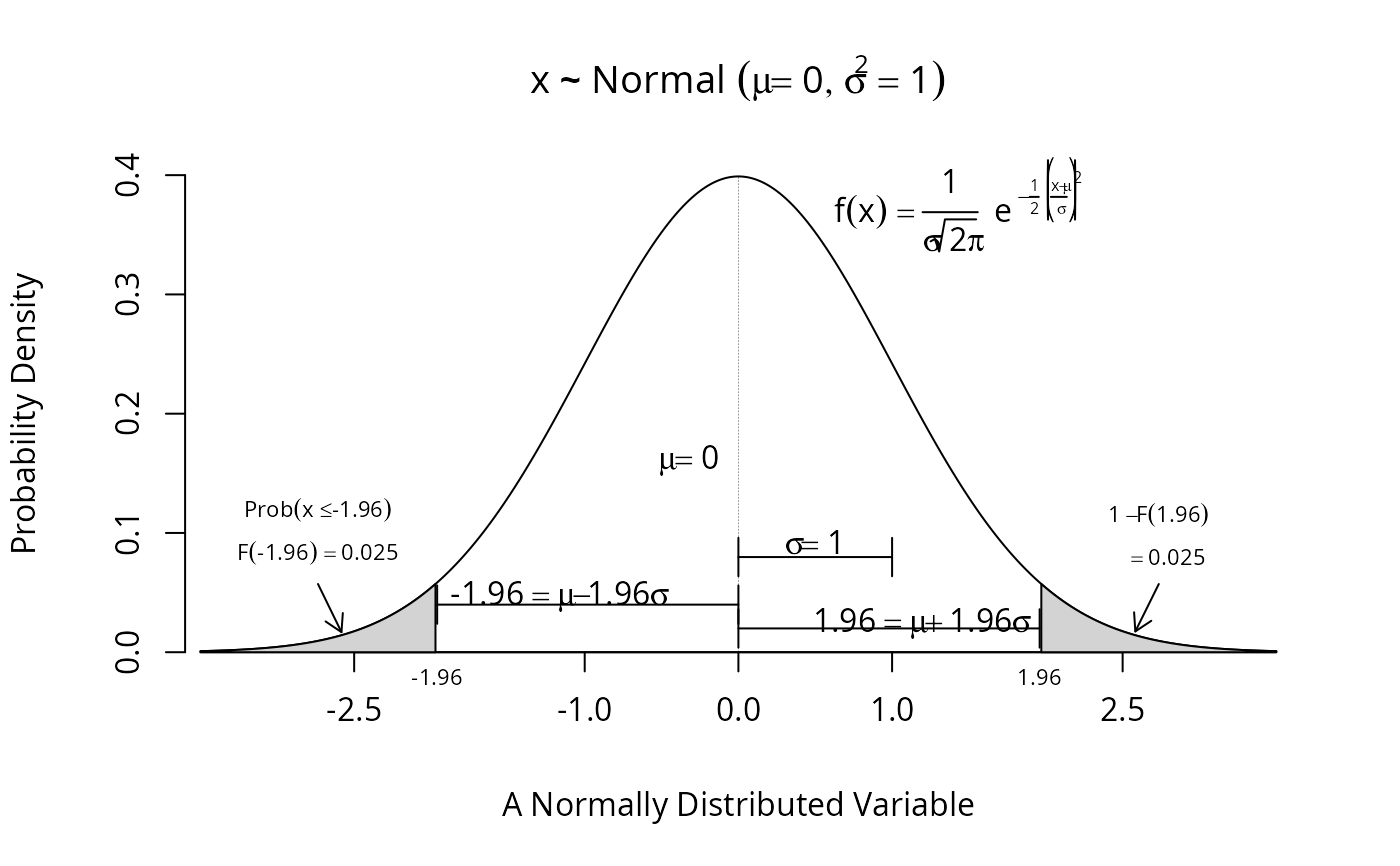
 drawnorm(mu= 0, sigma = 1)
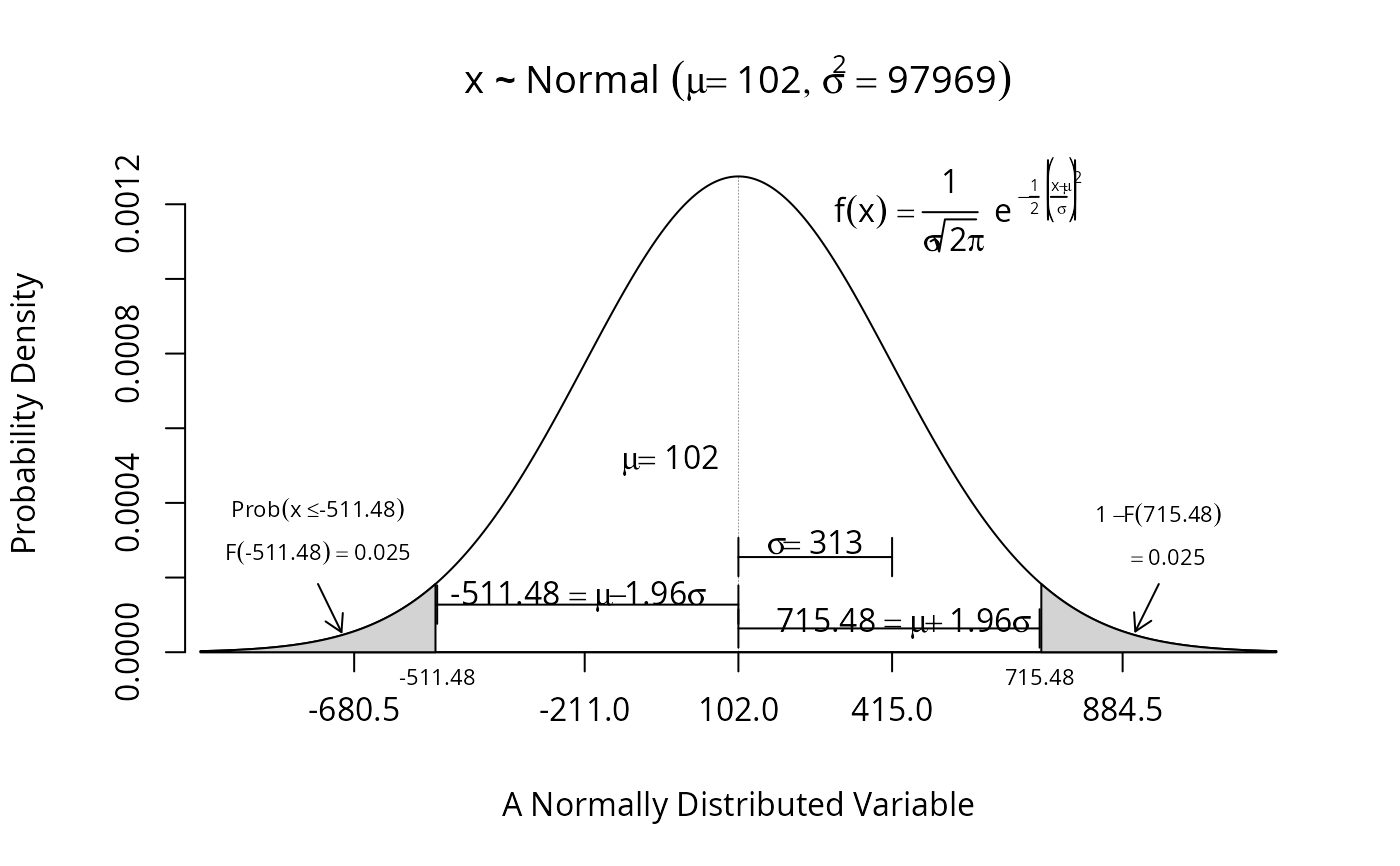
 drawnorm(mu = 102, sigma = 313)
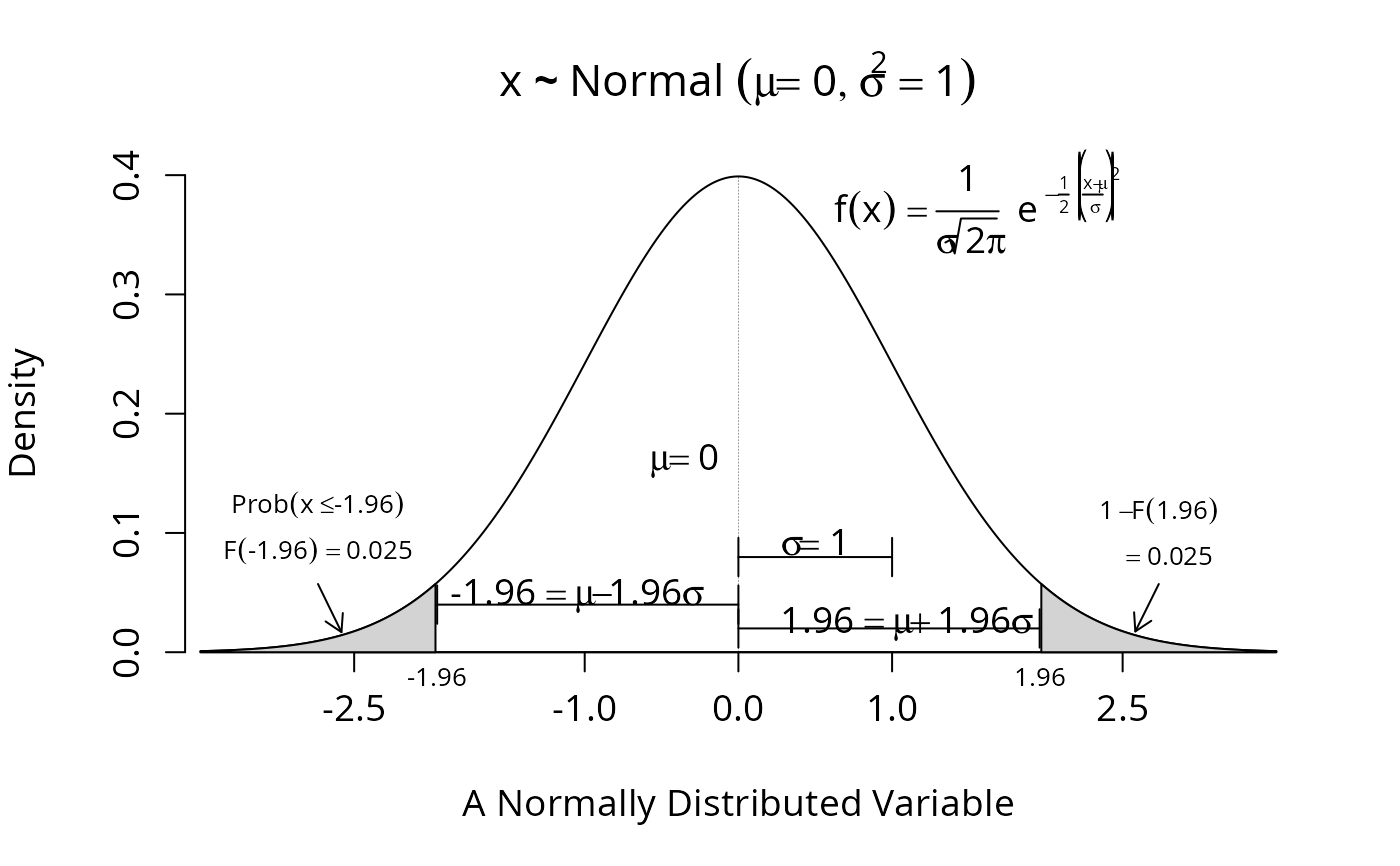
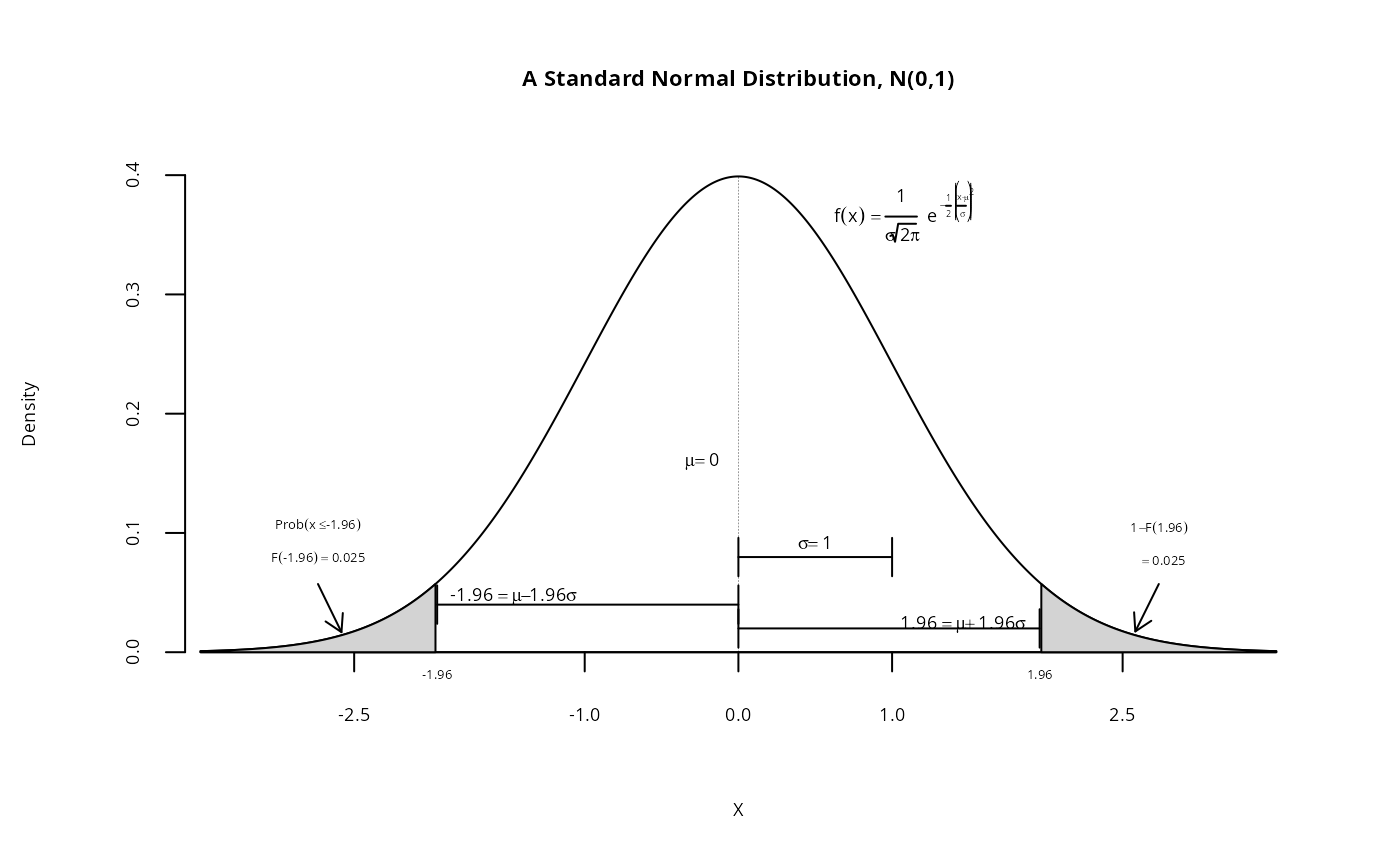
 drawnorm(mu = 0, sigma = 1, main = "A Standard Normal Distribution, N(0,1)",
xlab = "X", ylab = "Density", ps = 7)
drawnorm(mu = 0, sigma = 1, main = "A Standard Normal Distribution, N(0,1)",
xlab = "X", ylab = "Density", ps = 7)
 drawnorm(mu = 0, sigma = 1, ylab = "Density", ps = 14)