Kaplan-Meier Estimates vs. a Continuous Variable
groupkm.RdFunction to divide x (e.g. age, or predicted survival at time
u created by survest) into g quantile groups, get
Kaplan-Meier estimates at time u (a scaler), and to return a
matrix with columns x=mean x in quantile, n=number
of subjects, events=no. events, and KM=K-M survival at
time u, std.err = s.e. of -log K-M. Confidence intervals
are based on -log S(t). Instead of supplying g, the user can
supply the minimum number of subjects to have in the quantile group
(m, default=50). If cuts is given
(e.g. cuts=c(0,.1,.2,...,.9,.1)), it overrides m and
g. Calls Therneau's survfitKM in the survival
package to get Kaplan-Meiers estimates and standard errors.
Usage
groupkm(x, Srv, m=50, g, cuts, u,
        pl=FALSE, loglog=FALSE, conf.int=.95, xlab, ylab,
        lty=1, add=FALSE, cex.subtitle=.7, ...)
Arguments
- x
variable to stratify
- Srv
a
Survobject - n x 2 matrix containing survival time and event/censoring 1/0 indicator. Units of measurement come from the "units" attribute of the survival time variable. "Day" is the default.- m
desired minimum number of observations in a group
- g
number of quantile groups
- cuts
actual cuts in
x, e.g.c(0,1,2)to use [0,1), [1,2].- u
time for which to estimate survival
- pl
TRUE to plot results
- loglog
set to
TRUEto plotlog(-log(survival))instead of survival- conf.int
defaults to
.95for 0.95 confidence bars. Set toFALSEto suppress bars.- xlab
if
pl=TRUE, is x-axis label. Default islabel(x)or name of calling argument- ylab
if
pl=TRUE, is y-axis label. Default is constructed fromuand timeunitsattribute.- lty
line time for primary line connecting estimates
- add
set to
TRUEif adding to an existing plot- cex.subtitle
character size for subtitle. Default is
.7. UseFALSEto suppress subtitle.- ...
plotting parameters to pass to the plot and errbar functions
Value
matrix with columns named x (mean predictor value in interval), n (sample size
in interval), events (number of events in interval), KM (Kaplan-Meier
estimate), std.err (standard error of -log KM)
Examples
require(survival)
n <- 1000
set.seed(731)
age <- 50 + 12*rnorm(n)
cens <- 15*runif(n)
h <- .02*exp(.04*(age-50))
d.time <- -log(runif(n))/h
label(d.time) <- 'Follow-up Time'
e <- ifelse(d.time <= cens,1,0)
d.time <- pmin(d.time, cens)
units(d.time) <- "Year"
groupkm(age, Surv(d.time, e), g=10, u=5, pl=TRUE)
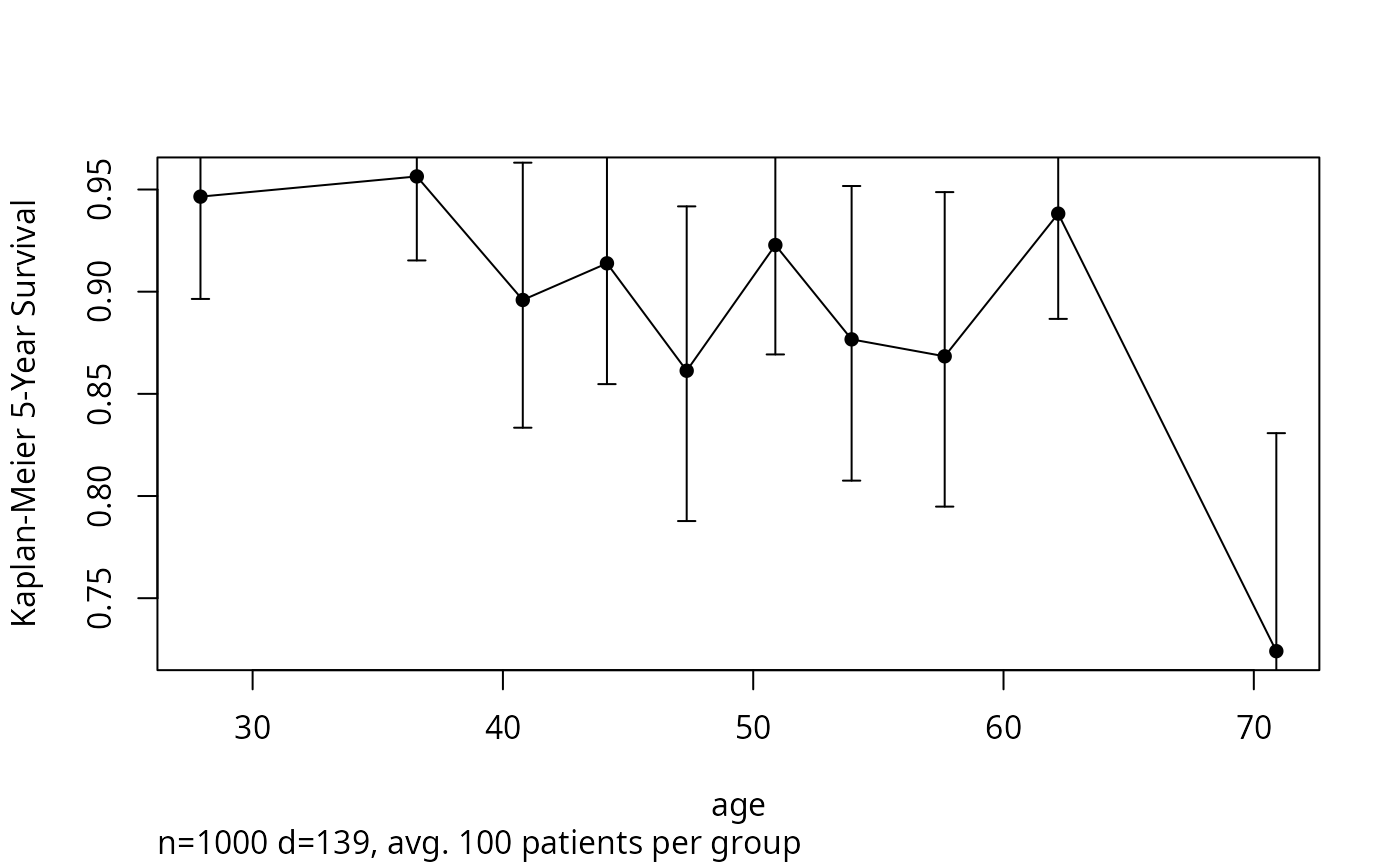 #> x n events KM std.err
#> [1,] 27.917 100 4 0.94651 0.027727
#> [2,] 36.560 100 6 0.95640 0.022420
#> [3,] 40.794 100 13 0.89594 0.036899
#> [4,] 44.157 100 11 0.91388 0.034117
#> [5,] 47.342 100 18 0.86132 0.045553
#> [6,] 50.884 100 10 0.92282 0.030492
#> [7,] 53.931 100 18 0.87666 0.041909
#> [8,] 57.650 100 18 0.86837 0.045158
#> [9,] 62.185 100 12 0.93819 0.028810
#> [10,] 70.899 100 29 0.72407 0.070133
#Plot 5-year K-M survival estimates and 0.95 confidence bars by
#decile of age. If omit g=10, will have >= 50 obs./group.
#> x n events KM std.err
#> [1,] 27.917 100 4 0.94651 0.027727
#> [2,] 36.560 100 6 0.95640 0.022420
#> [3,] 40.794 100 13 0.89594 0.036899
#> [4,] 44.157 100 11 0.91388 0.034117
#> [5,] 47.342 100 18 0.86132 0.045553
#> [6,] 50.884 100 10 0.92282 0.030492
#> [7,] 53.931 100 18 0.87666 0.041909
#> [8,] 57.650 100 18 0.86837 0.045158
#> [9,] 62.185 100 12 0.93819 0.028810
#> [10,] 70.899 100 29 0.72407 0.070133
#Plot 5-year K-M survival estimates and 0.95 confidence bars by
#decile of age. If omit g=10, will have >= 50 obs./group.