Plot a predicted line from a bivariate model
plotPredy.RdPlots the best fit line for a model with one y variable and one x variable, or with one y variable and polynomial x variables.
plotPredy(
  data,
  x,
  y,
  model,
  order = 1,
  x2 = NULL,
  x3 = NULL,
  x4 = NULL,
  x5 = NULL,
  pch = 16,
  xlab = "X",
  ylab = "Y",
  length = 1000,
  lty = 1,
  lwd = 2,
  col = "blue",
  type = NULL,
  ...
)
Arguments
- data
The name of the data frame.
- x
The name of the x variable.
- y
The name of the y variable.
- model
The name of the model object.
- order
If plotting a polynomial function, the order of the polynomial. Otherwise can be left as
1.- x2
If applicable, the name of the second order polynomial x variable.
- x3
If applicable, the name of the third order polynomial x variable.
- x4
If applicable, the name of the fourth order polynomial x variable.
- x5
If applicable, the name of the fifth order polynomial x variable.
- pch
The shape of the plotted data points.
- xlab
The label for the x-axis.
- ylab
The label for the y-axis.
- length
The number of points used to draw the line.
- lty
The style of the plotted line.
- lwd
The width of the plotted line.
- col
The col of the plotted line.
- type
Passed to
predict. Required for certain models.- ...
Other arguments passed to
plot.
Value
Produces a plot. Returns nothing.
Details
Any model for which predict() is defined can be used.
References
Examples
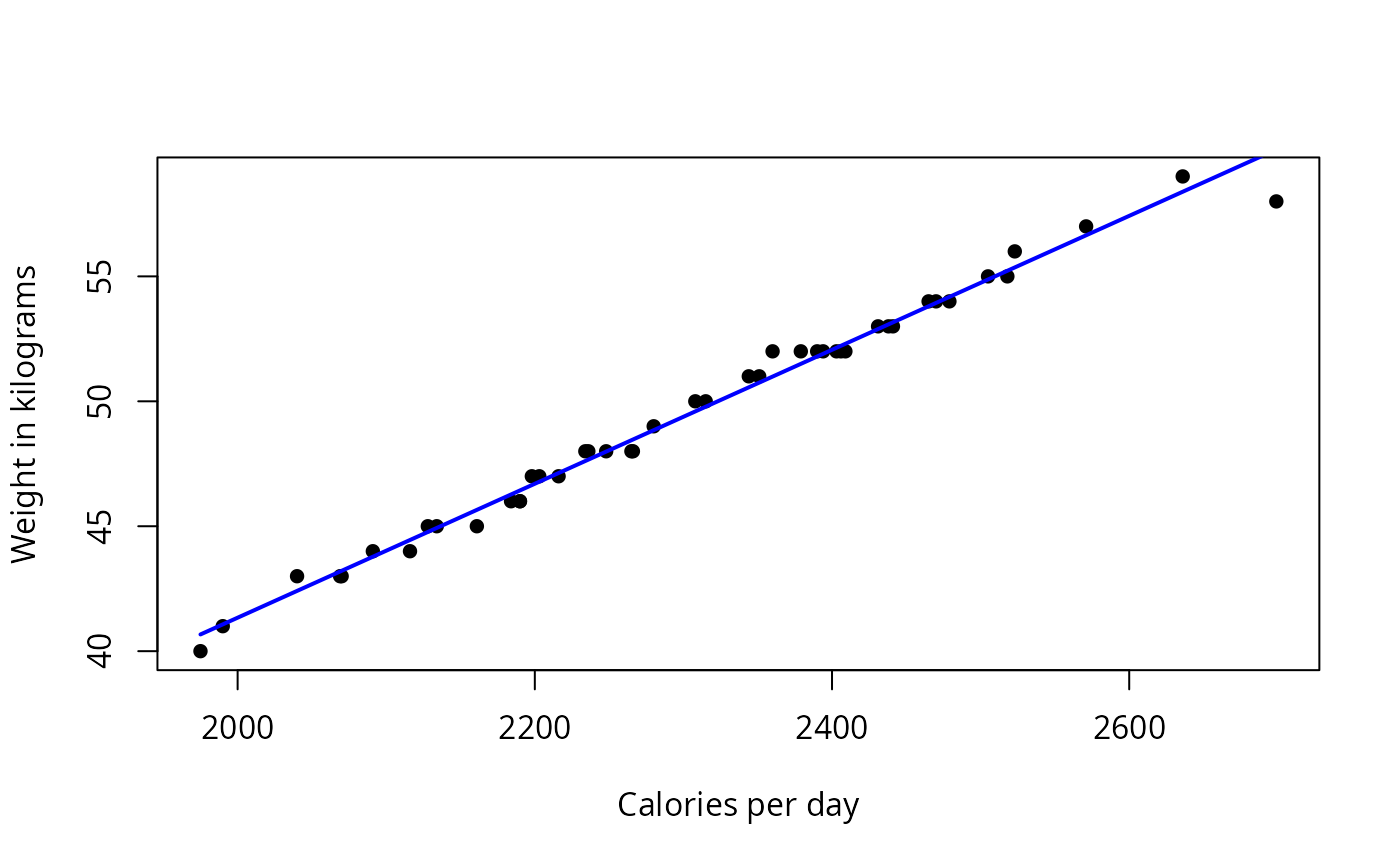
### Plot of linear model fit with lm
data(BrendonSmall)
model = lm(Weight ~ Calories, data = BrendonSmall)
plotPredy(data = BrendonSmall,
y = Weight,
x = Calories,
model = model,
xlab = "Calories per day",
ylab = "Weight in kilograms")
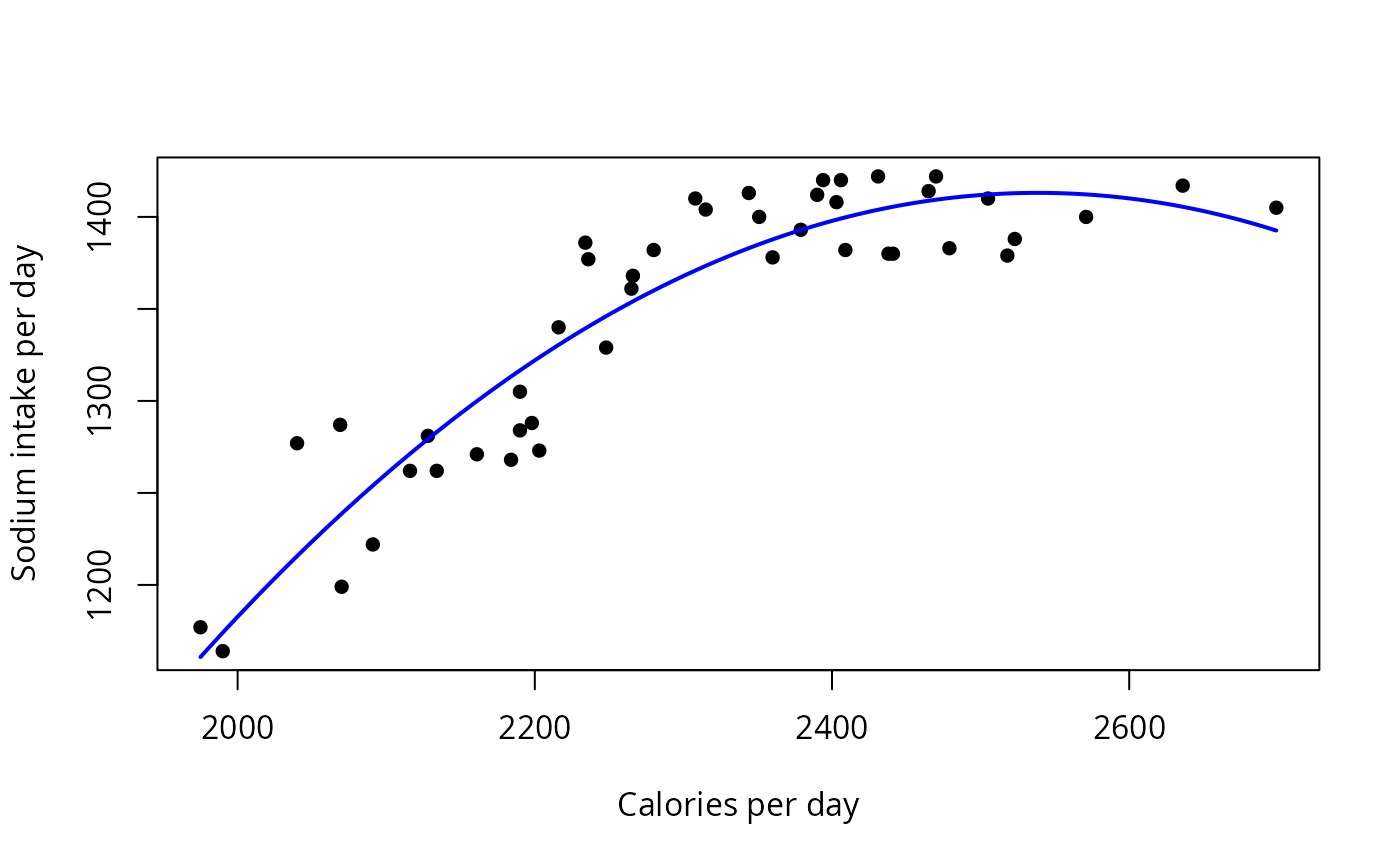
 ### Plot of polynomial model fit with lm
data(BrendonSmall)
BrendonSmall$Calories2 = BrendonSmall$Calories * BrendonSmall$Calories
model = lm(Sodium ~ Calories + Calories2, data = BrendonSmall)
plotPredy(data = BrendonSmall,
y = Sodium,
x = Calories,
x2 = Calories2,
model = model,
order = 2,
xlab = "Calories per day",
ylab = "Sodium intake per day")
### Plot of polynomial model fit with lm
data(BrendonSmall)
BrendonSmall$Calories2 = BrendonSmall$Calories * BrendonSmall$Calories
model = lm(Sodium ~ Calories + Calories2, data = BrendonSmall)
plotPredy(data = BrendonSmall,
y = Sodium,
x = Calories,
x2 = Calories2,
model = model,
order = 2,
xlab = "Calories per day",
ylab = "Sodium intake per day")
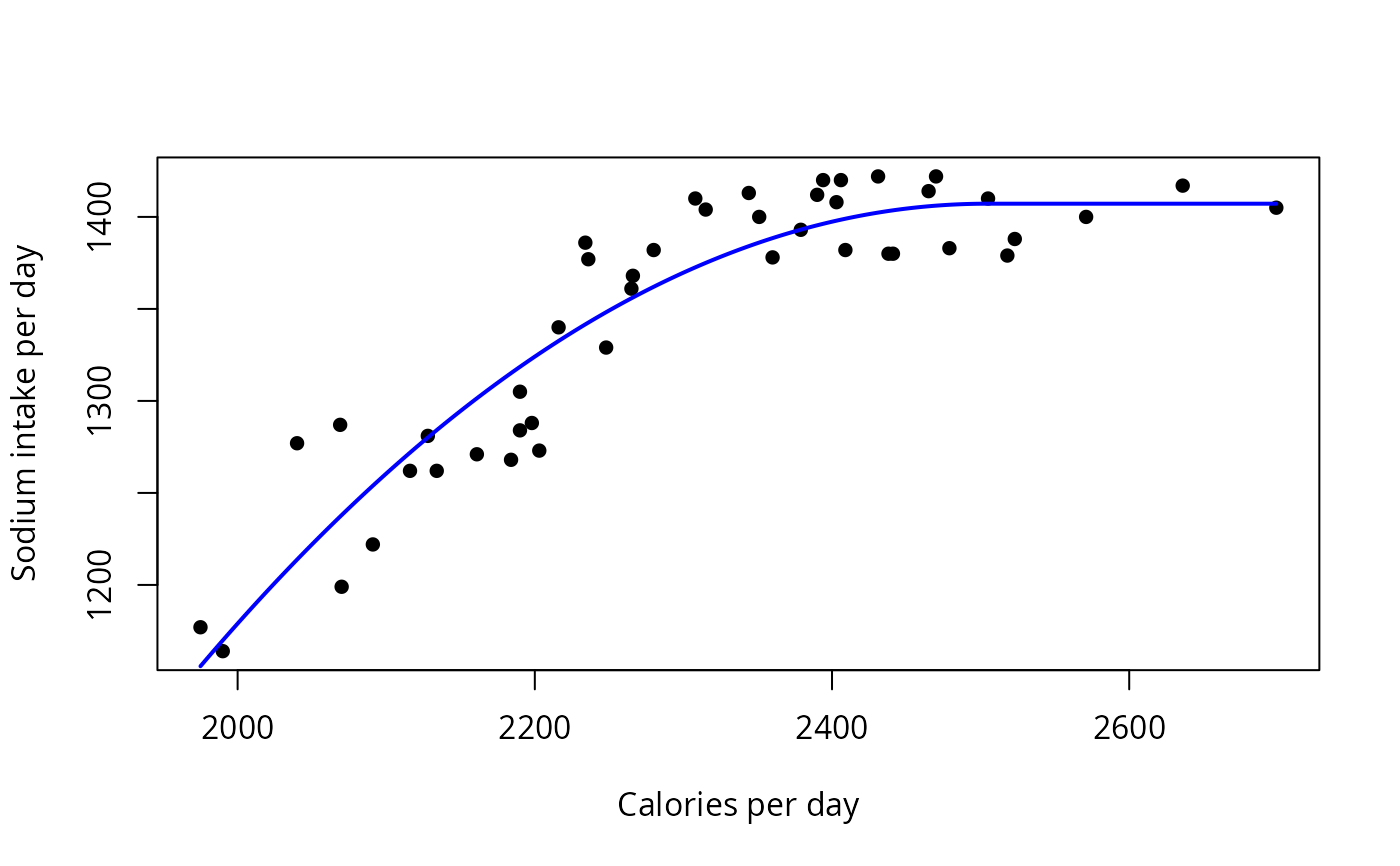
 ### Plot of quadratic plateau model fit with nls
data(BrendonSmall)
quadplat = function(x, a, b, clx) {
ifelse(x < clx, a + b * x + (-0.5*b/clx) * x * x,
a + b * clx + (-0.5*b/clx) * clx * clx)}
model = nls(Sodium ~ quadplat(Calories, a, b, clx),
data = BrendonSmall,
start = list(a = 519,
b = 0.359,
clx = 2304))
plotPredy(data = BrendonSmall,
y = Sodium,
x = Calories,
model = model,
xlab = "Calories per day",
ylab = "Sodium intake per day")
### Plot of quadratic plateau model fit with nls
data(BrendonSmall)
quadplat = function(x, a, b, clx) {
ifelse(x < clx, a + b * x + (-0.5*b/clx) * x * x,
a + b * clx + (-0.5*b/clx) * clx * clx)}
model = nls(Sodium ~ quadplat(Calories, a, b, clx),
data = BrendonSmall,
start = list(a = 519,
b = 0.359,
clx = 2304))
plotPredy(data = BrendonSmall,
y = Sodium,
x = Calories,
model = model,
xlab = "Calories per day",
ylab = "Sodium intake per day")
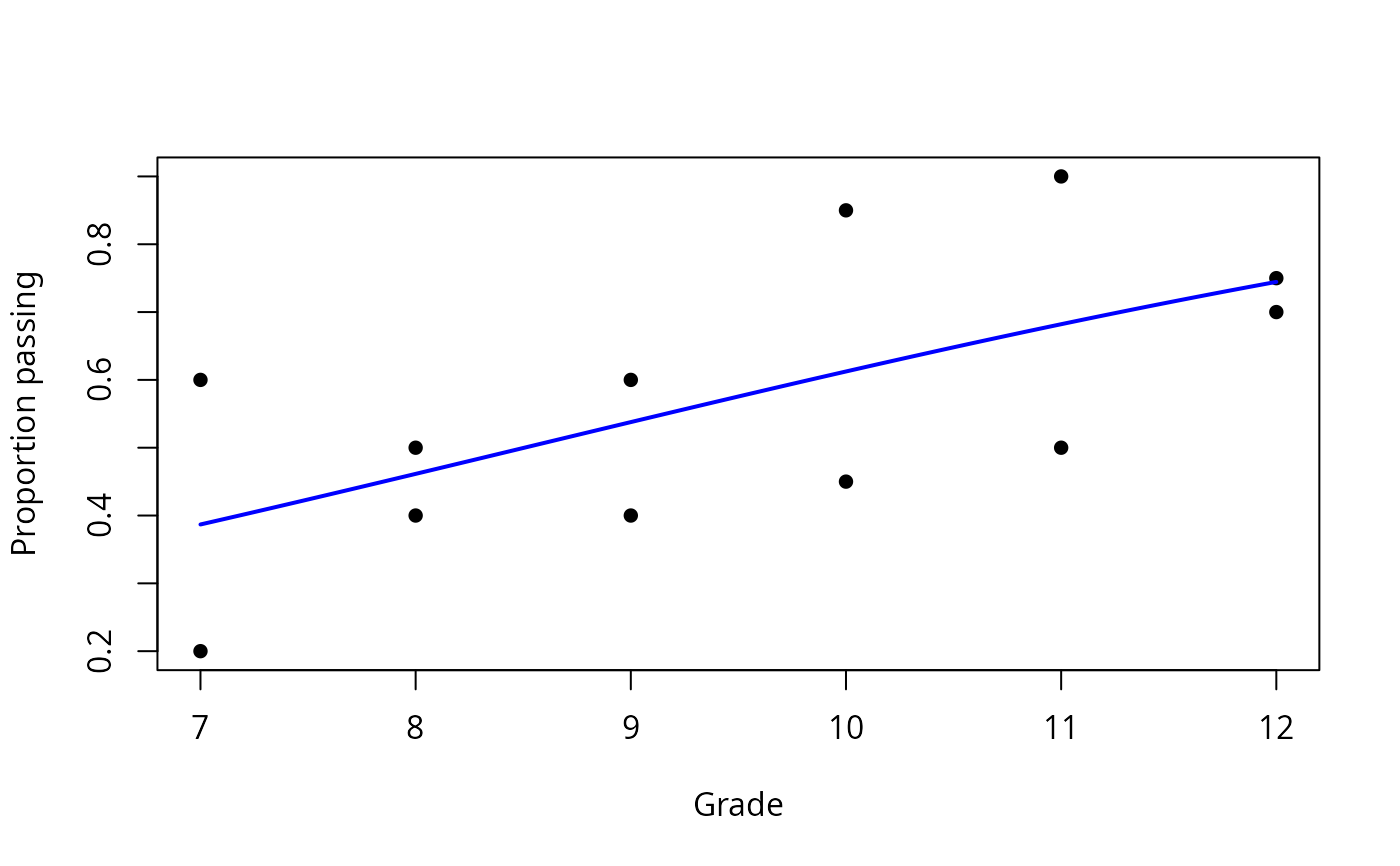
 ### Logistic regression example requires type option
data(BullyHill)
Trials = cbind(BullyHill$Pass, BullyHill$Fail)
model.log = glm(Trials ~ Grade, data = BullyHill,
family = binomial(link="logit"))
plotPredy(data = BullyHill,
y = Percent,
x = Grade,
model = model.log,
type = "response",
xlab = "Grade",
ylab = "Proportion passing")
### Logistic regression example requires type option
data(BullyHill)
Trials = cbind(BullyHill$Pass, BullyHill$Fail)
model.log = glm(Trials ~ Grade, data = BullyHill,
family = binomial(link="logit"))
plotPredy(data = BullyHill,
y = Percent,
x = Grade,
model = model.log,
type = "response",
xlab = "Grade",
ylab = "Proportion passing")