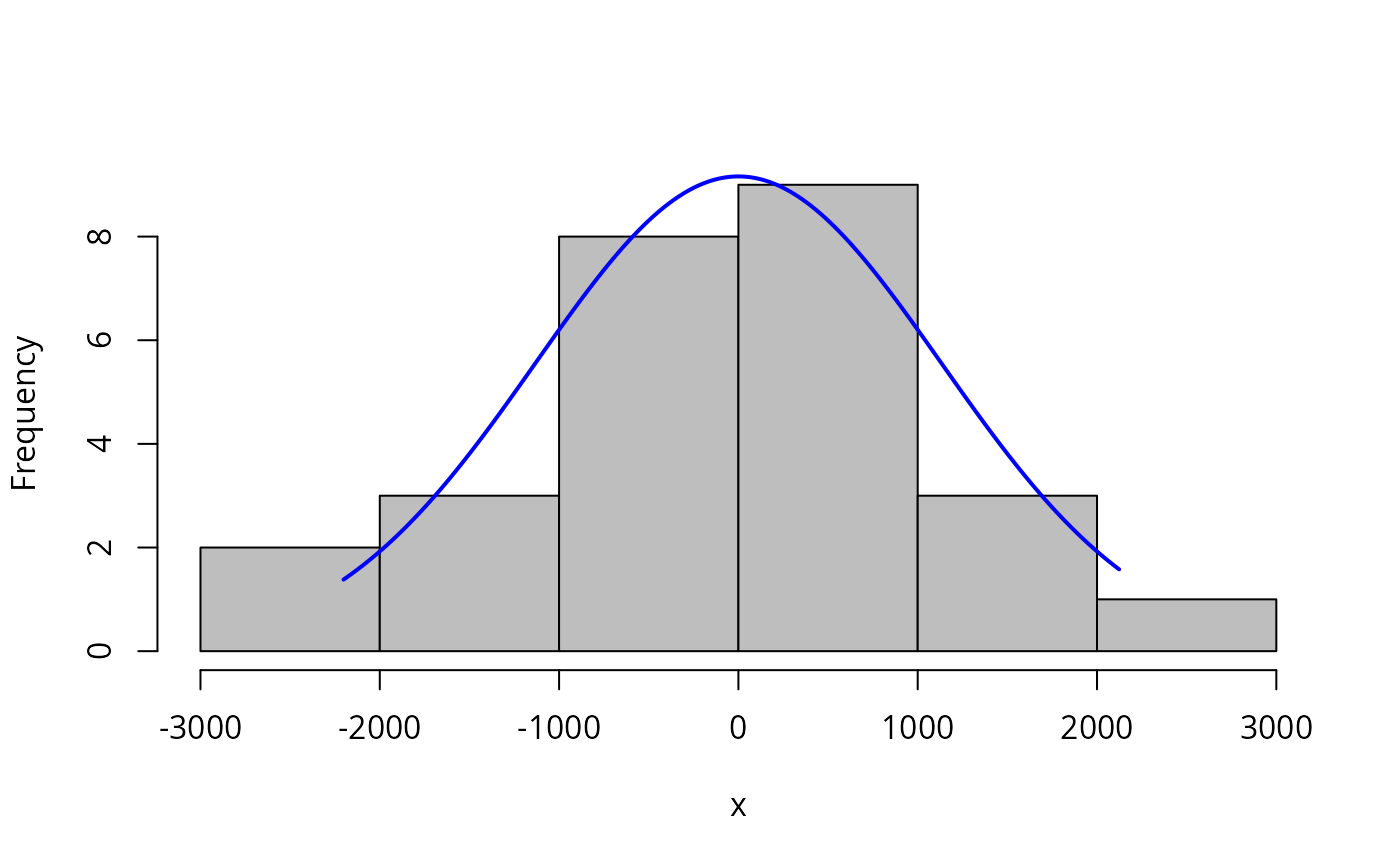
Histogram with a normal curve
plotNormalHistogram.RdProduces a histogram for a vector of values and adds a normal curve with the same mean and standard deviation. The plot can be used to quickly compare the distribution of data to a normal distribution.
plotNormalHistogram(
  x,
  prob = FALSE,
  col = "gray",
  main = "",
  linecol = "blue",
  lwd = 2,
  length = 1000,
  ...
)
Arguments
- x
A vector of values.
- prob
If
FALSE, then counts are displayed in the histogram. IfTRUE, then the density is shown.- col
The color of the histogram bars.
- main
The title displayed for the plot.
- linecol
The color of the line in the plot.
- lwd
The width of the line in the plot.
- length
The number of points in the line in the plot.
- ...
Other arguments passed to
hist.
Value
Produces a plot. Returns nothing.
Details
The function relies on the hist function. The normal curve
has the same mean and standard deviation as the values in the
vector.