Automated plotting of the states and transitions that characterize a multi states model.
Usage
# S3 method for class 'Hist'
plot(
  x,
  nrow,
  ncol,
  box.width,
  box.height,
  box.padding,
  xbox.position,
  ybox.position,
  stateLabels,
  arrowLabels,
  arrowLabelStyle = "symbolic",
  arrowLabelSymbol = "lambda",
  changeArrowLabelSide,
  curved,
  tagBoxes = FALSE,
  startCountZero = TRUE,
  oneFitsAll,
  margin,
  cex,
  rasta = FALSE,
  verbose = FALSE,
  ...
)
Arguments
- x
An object of class
Hist.- nrow
the number of graphic rows
- ncol
the number of graphic columns
- box.width
the widths of the boxes on the scale from 0 to 100
- box.height
the heights of the boxes on the scale from 0 to 100
- box.padding
how much room there should be between the label and the border of a box. Two values on the scale from 0 to 100: the first for the horizontal x-direction and the second for the vertical y-direction padding.
- xbox.position
the x box positions (left lower corner) on the scale from 0 to 100.
- ybox.position
the y box positions (left lower corner) on the scale from 0 to 100.
- stateLabels
Vector of names to appear in the boxes (states). Defaults to attr(x,"state.names"). The boxes can also be individually labeled by smart arguments of the form
box3.label="diseased", see examples.- arrowLabels
Vector of labels to appear in the boxes (states). One for each arrow. The arrows can also be individually labeled by smart arguments of the form
arrow1.label=paste(expression(eta(s,u))), see examples.- arrowLabelStyle
Either "symbolic" for automated symbolic arrow labels, or "count" for arrow labels that reflect the number of transitions in the data.
- arrowLabelSymbol
Symbol for automated symbolic arrow labels. Defaults to "lambda".
- changeArrowLabelSide
A vector of mode logical (TRUE,FALSE) one for each arrow to change the side of the arrow on which the label is placed.
- curved
The curvature of curved arrows via diagram::curvedarrow. Experimental. Values between 0 (no curvature) and 1 are meaningful.
- tagBoxes
Logical. If TRUE the boxes are numbered in the upper left corner. The size can be controlled with smart argument boxtags.cex. The default is boxtags.cex=1.28.
- startCountZero
Control states numbers for symbolic arrow labels and box tags.
- oneFitsAll
If
FALSEthen boxes have individual size, depending on the size of the label, otherwise all boxes have the same size dependent on the largest label.- margin
Set the figure margin via
par(mar=margin). Less than 4 values are repeated.- cex
Initial cex value for the state and the arrow
labels.- rasta
For construction purposes.
- verbose
If TRUE echo various things.
- ...
Smart control of arguments for the subroutines text (box label), rect (box), arrows, text (arrow label). Thus the three dots can be used to draw individual boxes with individual labels, arrows and arrow labels. E.g. arrow2.label="any label" changes the label of the second arrow. See examples.
Note
Use the functionality of the unix program `dot' http://www.graphviz.org/About.php via R package Rgraphviz to obtain more complex graphs.
Author
Thomas A Gerds tag@biostat.ku.dk
Examples
## A simple survival model
SurvFrame <- data.frame(time=1:10,status=c(0,1,1,0,0,1,0,0,1,0))
SurvHist <- with(SurvFrame,Hist(time,status))
plot(SurvHist)
#> Warning: The dimension of the boxes may depend on the current graphical device
#> in the sense that the layout and centering of text may change when you resize the graphical device and call the same plot.
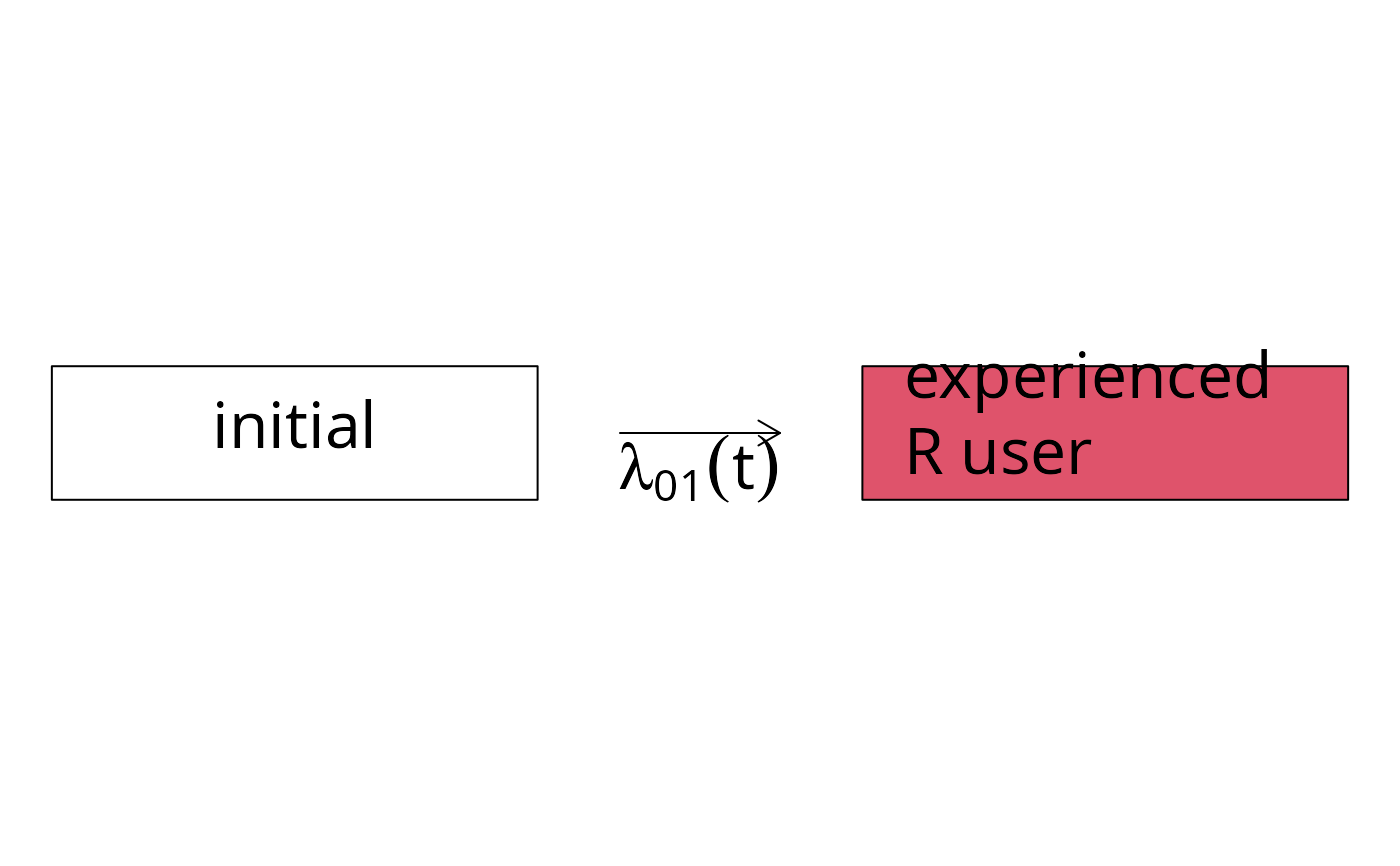
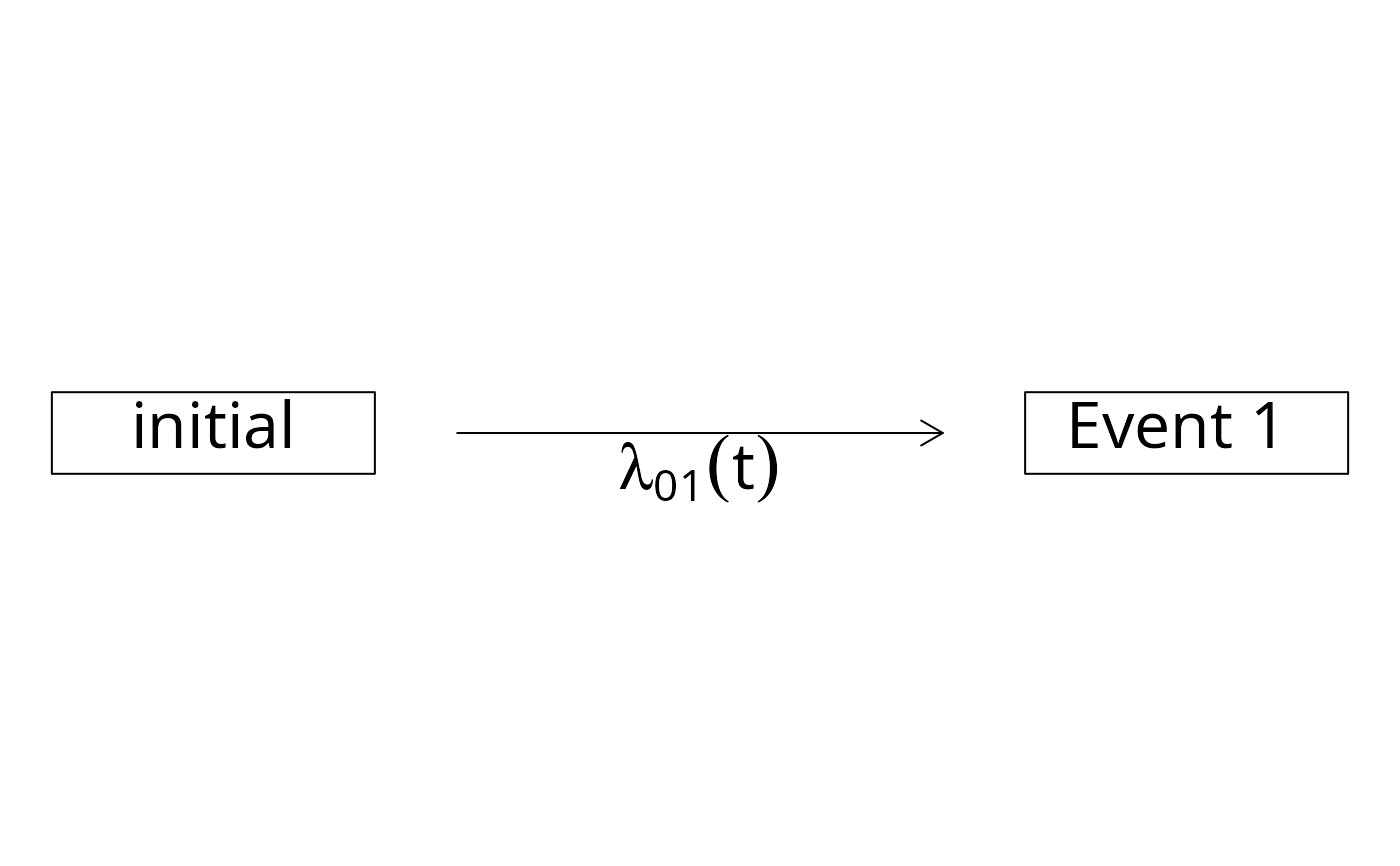 plot(SurvHist,box2.col=2,box2.label="experienced\nR user")
#> Warning: The dimension of the boxes may depend on the current graphical device
#> in the sense that the layout and centering of text may change when you resize the graphical device and call the same plot.
plot(SurvHist,box2.col=2,box2.label="experienced\nR user")
#> Warning: The dimension of the boxes may depend on the current graphical device
#> in the sense that the layout and centering of text may change when you resize the graphical device and call the same plot.
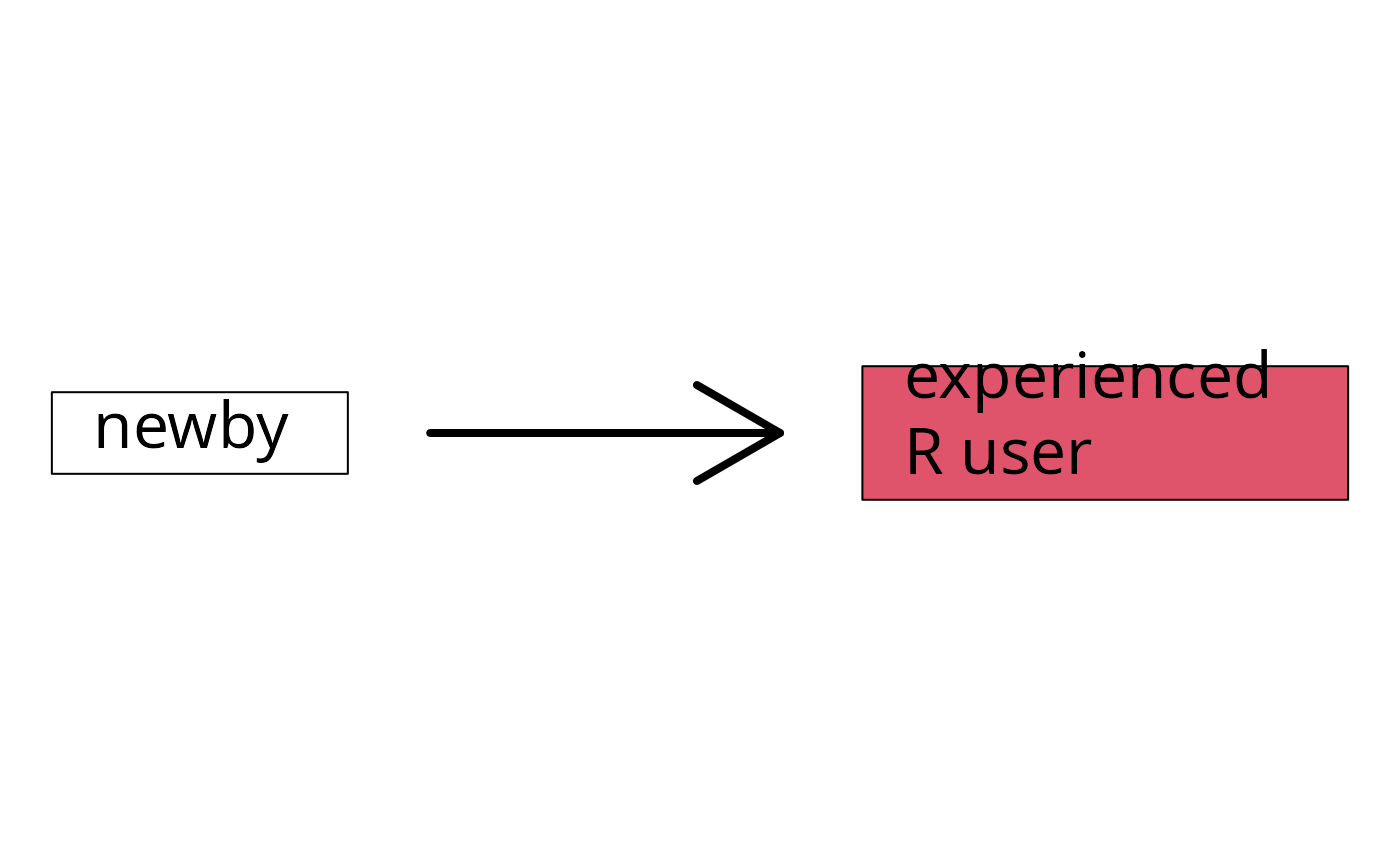
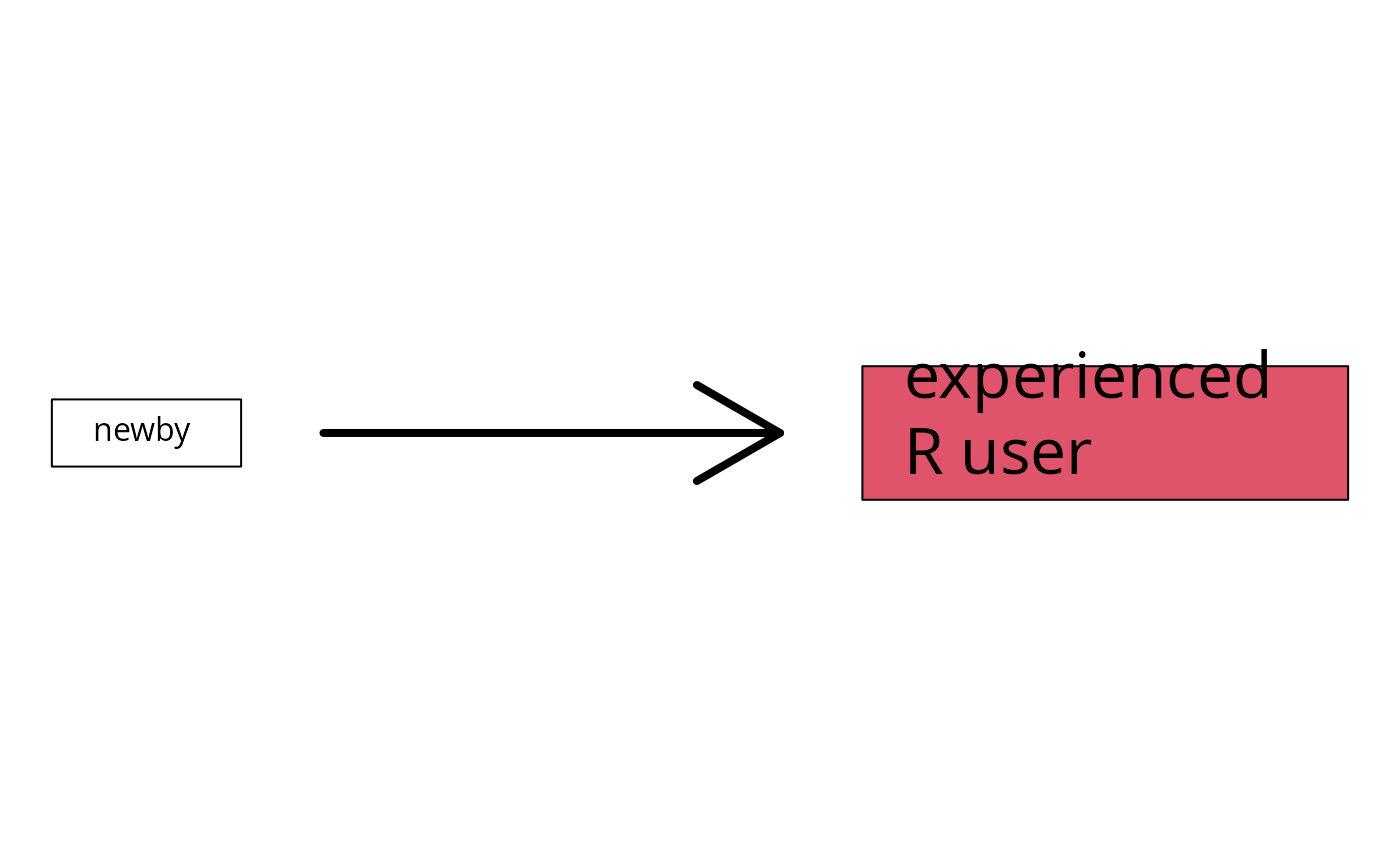
 plot(SurvHist,
box2.col=2,
box1.label="newby",
box2.label="experienced\nR user",
oneFitsAll=FALSE,
arrow1.length=.5,
arrow1.label="",
arrow1.lwd=4)
#> Warning: The dimension of the boxes may depend on the current graphical device
#> in the sense that the layout and centering of text may change when you resize the graphical device and call the same plot.
plot(SurvHist,
box2.col=2,
box1.label="newby",
box2.label="experienced\nR user",
oneFitsAll=FALSE,
arrow1.length=.5,
arrow1.label="",
arrow1.lwd=4)
#> Warning: The dimension of the boxes may depend on the current graphical device
#> in the sense that the layout and centering of text may change when you resize the graphical device and call the same plot.
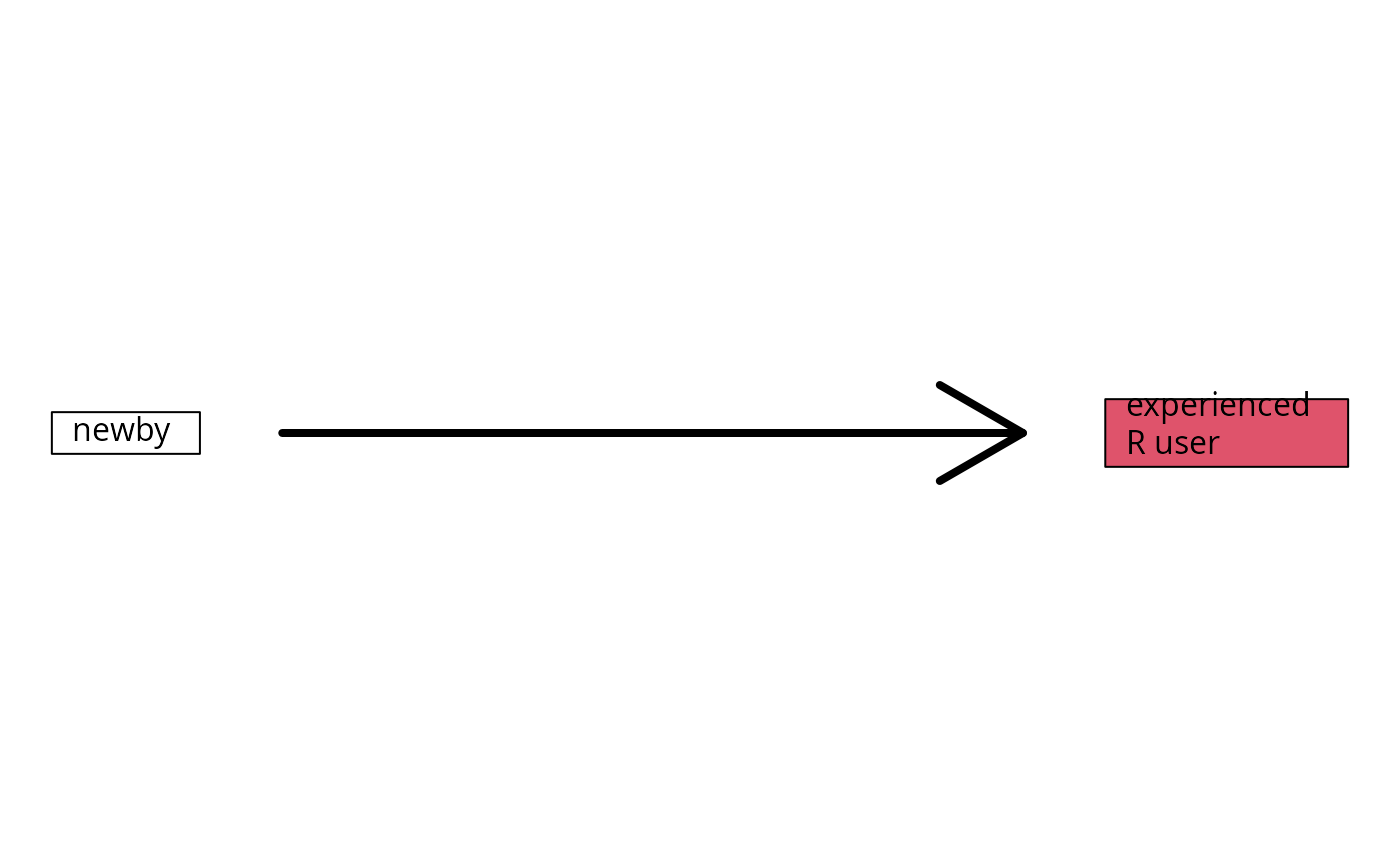
 ## change the cex of all box labels:
plot(SurvHist,
box2.col=2,
box1.label="newby",
box2.label="experienced\nR user",
oneFitsAll=FALSE,
arrow1.length=.5,
arrow1.label="",
arrow1.lwd=4,
label.cex=1)
#> Warning: The dimension of the boxes may depend on the current graphical device
#> in the sense that the layout and centering of text may change when you resize the graphical device and call the same plot.
## change the cex of all box labels:
plot(SurvHist,
box2.col=2,
box1.label="newby",
box2.label="experienced\nR user",
oneFitsAll=FALSE,
arrow1.length=.5,
arrow1.label="",
arrow1.lwd=4,
label.cex=1)
#> Warning: The dimension of the boxes may depend on the current graphical device
#> in the sense that the layout and centering of text may change when you resize the graphical device and call the same plot.
 ## change the cex of single box labels:
plot(SurvHist,
box2.col=2,
box1.label="newby",
box2.label="experienced\nR user",
oneFitsAll=FALSE,
arrow1.length=.5,
arrow1.label="",
arrow1.lwd=4,
label1.cex=1,
label2.cex=2)
#> Warning: The dimension of the boxes may depend on the current graphical device
#> in the sense that the layout and centering of text may change when you resize the graphical device and call the same plot.
## change the cex of single box labels:
plot(SurvHist,
box2.col=2,
box1.label="newby",
box2.label="experienced\nR user",
oneFitsAll=FALSE,
arrow1.length=.5,
arrow1.label="",
arrow1.lwd=4,
label1.cex=1,
label2.cex=2)
#> Warning: The dimension of the boxes may depend on the current graphical device
#> in the sense that the layout and centering of text may change when you resize the graphical device and call the same plot.
 ## The pbc data set from the survival package
library(survival)
data(pbc)
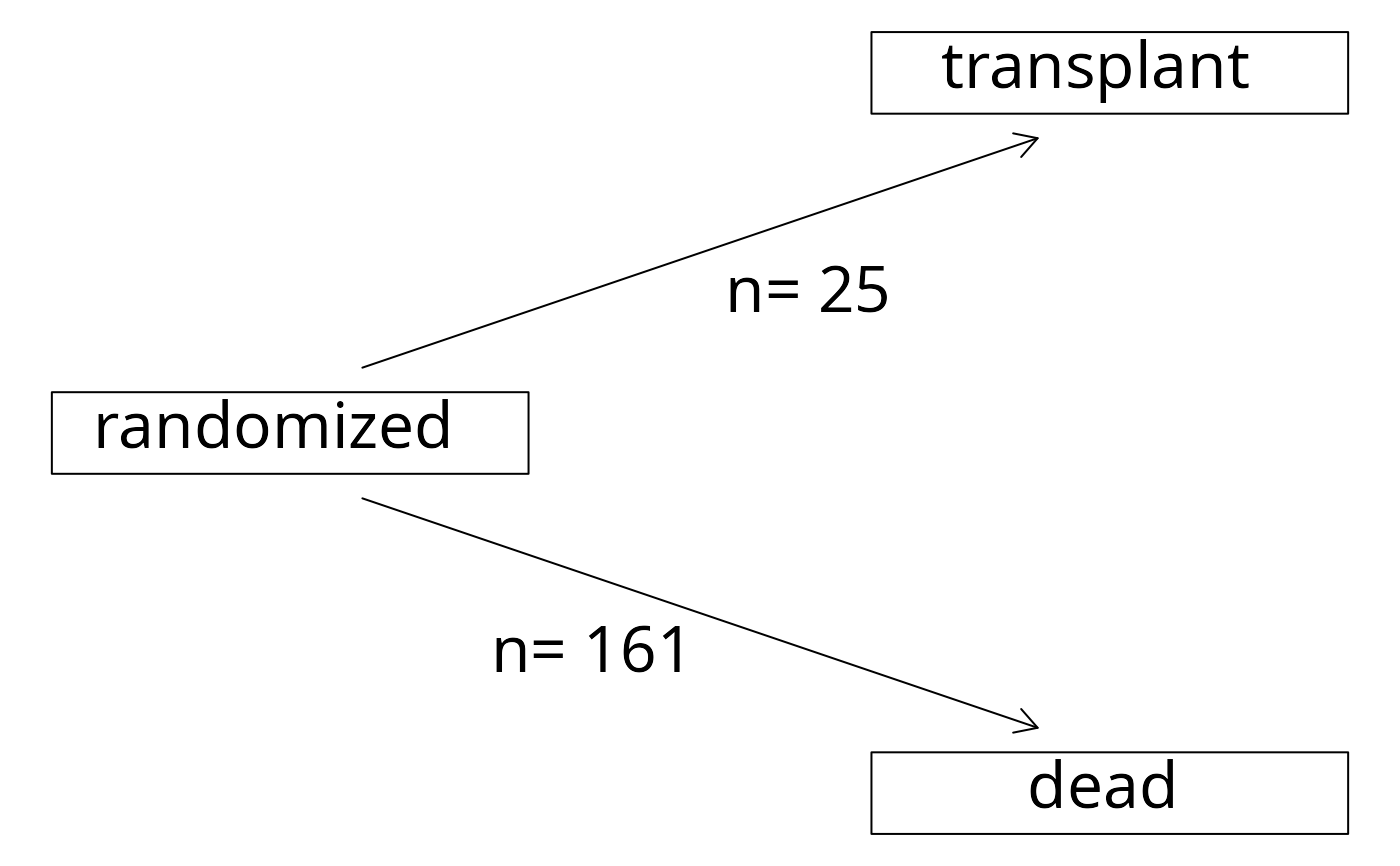
plot(with(pbc,Hist(time,status)),
stateLabels=c("randomized","transplant","dead"),
arrowLabelStyle="count")
#> Warning: The dimension of the boxes may depend on the current graphical device
#> in the sense that the layout and centering of text may change when you resize the graphical device and call the same plot.
## The pbc data set from the survival package
library(survival)
data(pbc)
plot(with(pbc,Hist(time,status)),
stateLabels=c("randomized","transplant","dead"),
arrowLabelStyle="count")
#> Warning: The dimension of the boxes may depend on the current graphical device
#> in the sense that the layout and centering of text may change when you resize the graphical device and call the same plot.
 ## two competing risks
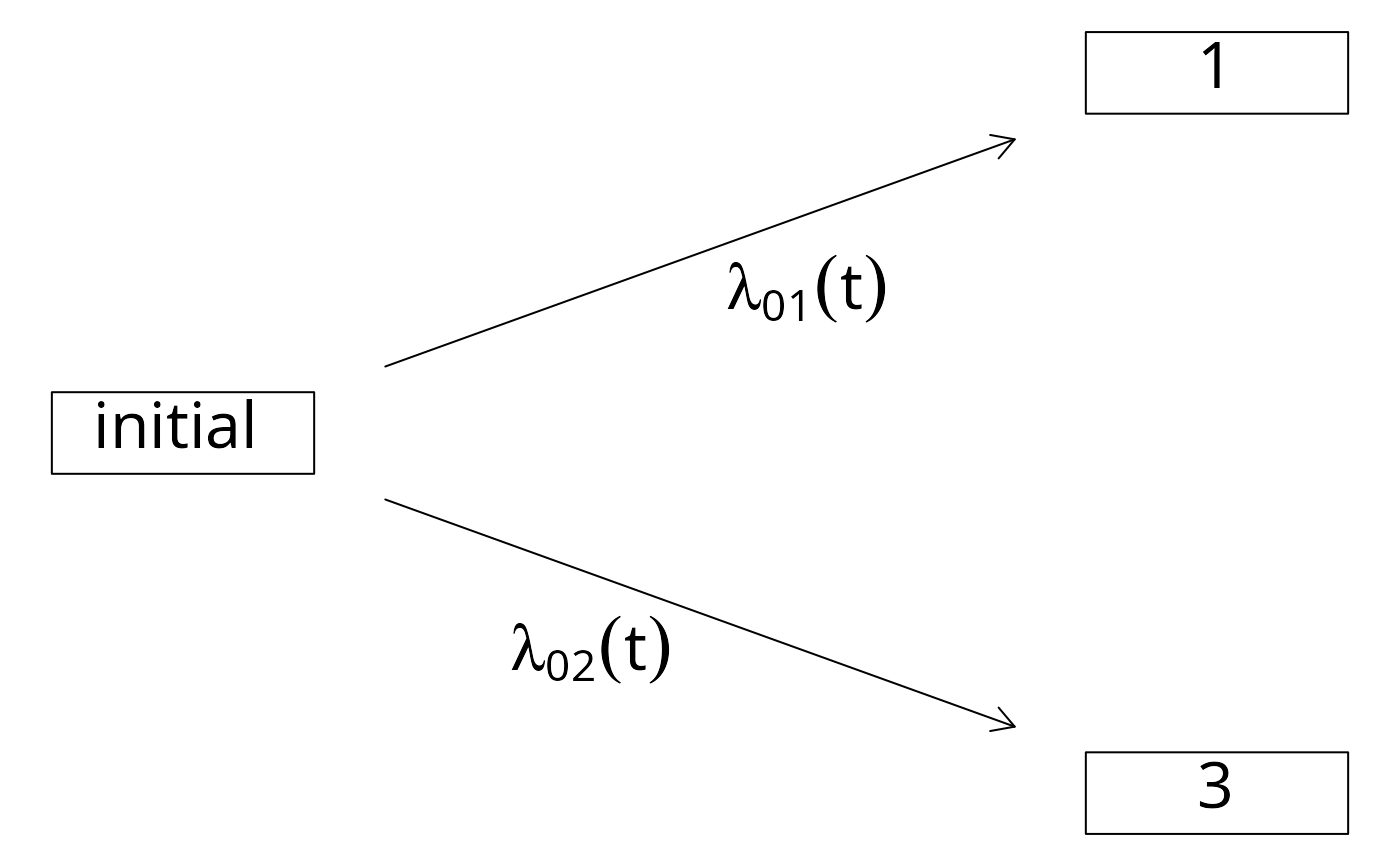
comprisk.model <- data.frame(time=1:3,status=1:3)
CRHist <- with(comprisk.model,Hist(time,status,cens.code=2))
plot(CRHist)
#> Warning: The dimension of the boxes may depend on the current graphical device
#> in the sense that the layout and centering of text may change when you resize the graphical device and call the same plot.
## two competing risks
comprisk.model <- data.frame(time=1:3,status=1:3)
CRHist <- with(comprisk.model,Hist(time,status,cens.code=2))
plot(CRHist)
#> Warning: The dimension of the boxes may depend on the current graphical device
#> in the sense that the layout and centering of text may change when you resize the graphical device and call the same plot.
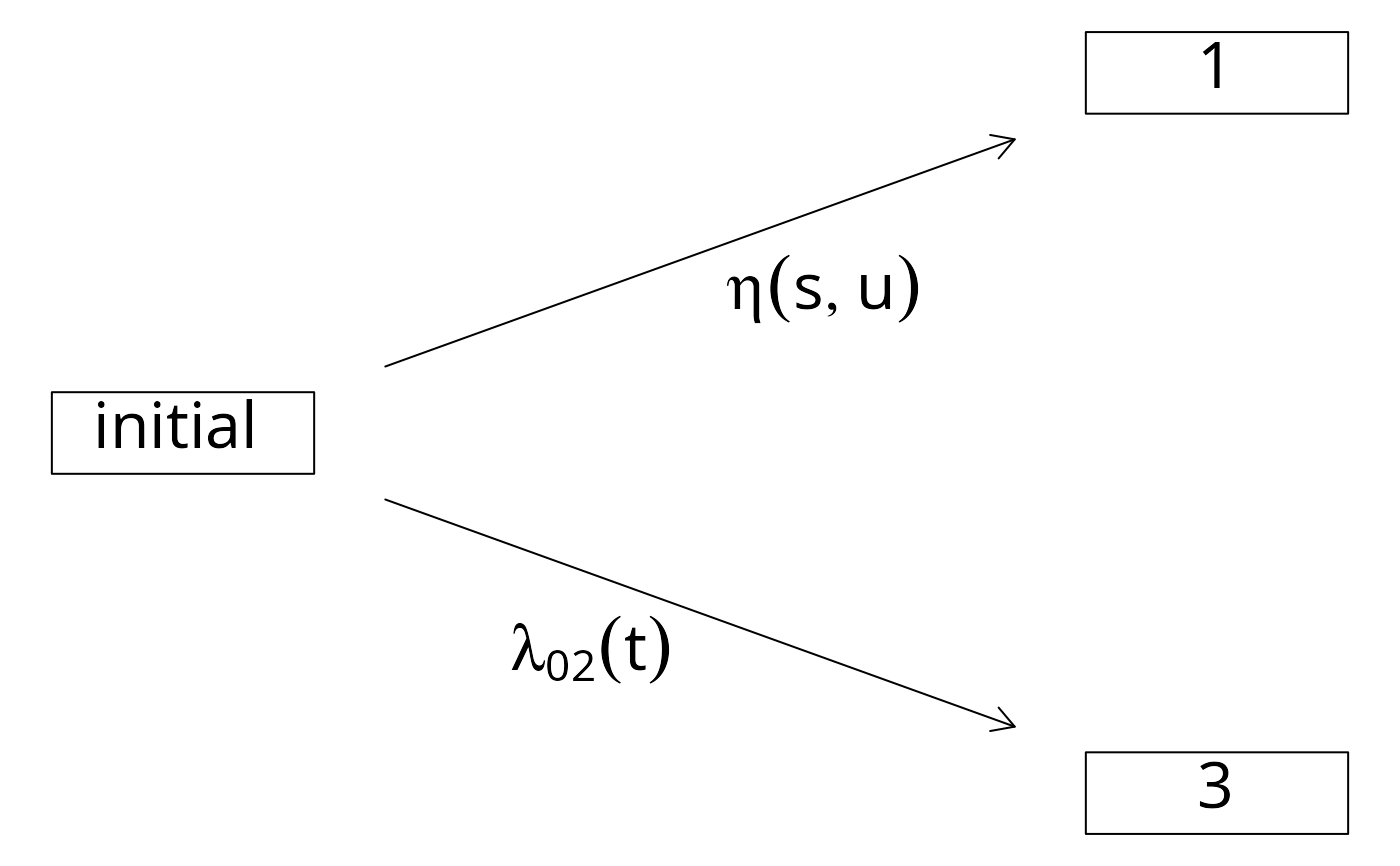
 plot(CRHist,arrow1.label=paste(expression(eta(s,u))))
#> Warning: The dimension of the boxes may depend on the current graphical device
#> in the sense that the layout and centering of text may change when you resize the graphical device and call the same plot.
plot(CRHist,arrow1.label=paste(expression(eta(s,u))))
#> Warning: The dimension of the boxes may depend on the current graphical device
#> in the sense that the layout and centering of text may change when you resize the graphical device and call the same plot.
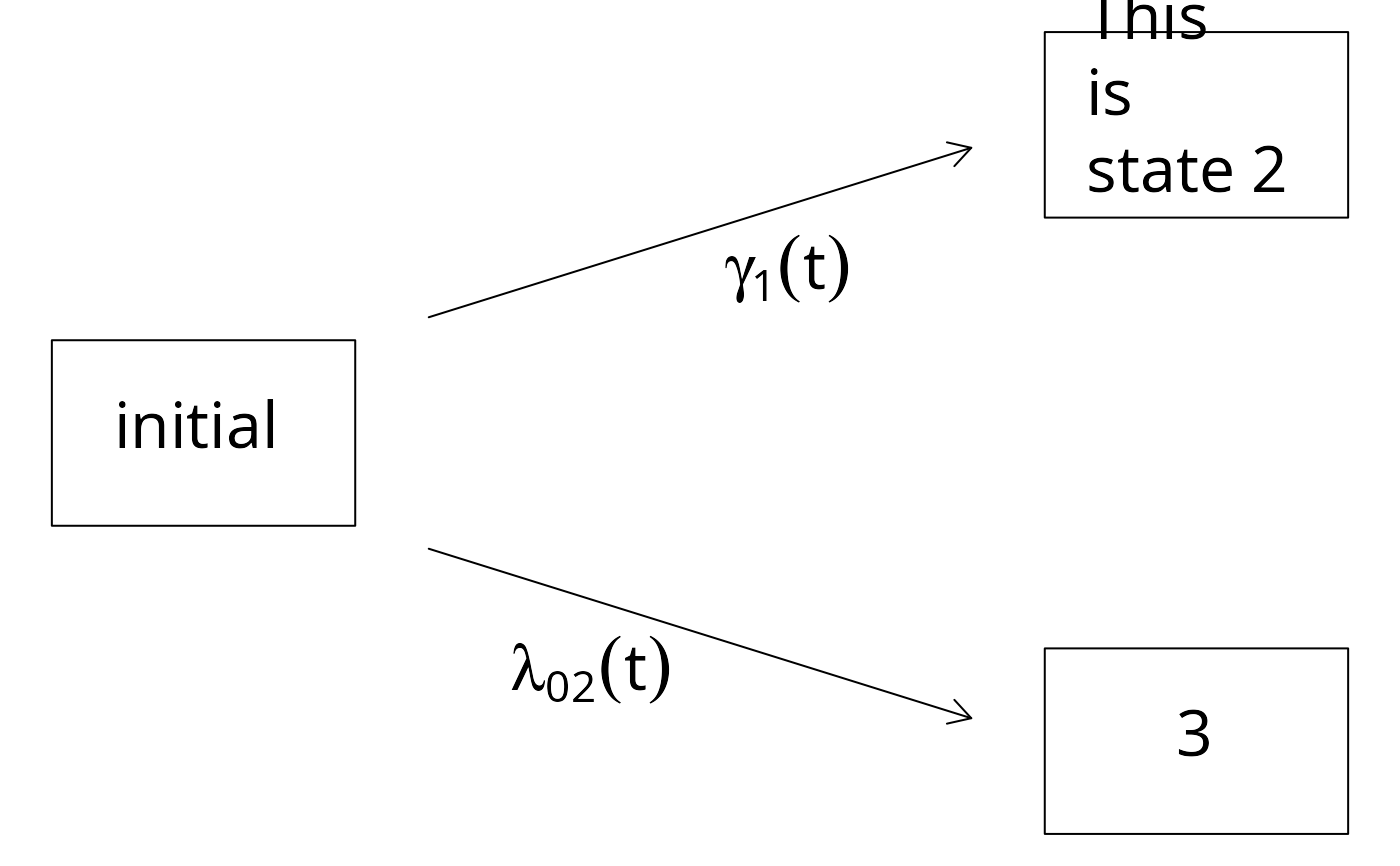
 plot(CRHist,box2.label="This\nis\nstate 2",arrow1.label=paste(expression(gamma[1](t))))
#> Warning: The dimension of the boxes may depend on the current graphical device
#> in the sense that the layout and centering of text may change when you resize the graphical device and call the same plot.
plot(CRHist,box2.label="This\nis\nstate 2",arrow1.label=paste(expression(gamma[1](t))))
#> Warning: The dimension of the boxes may depend on the current graphical device
#> in the sense that the layout and centering of text may change when you resize the graphical device and call the same plot.
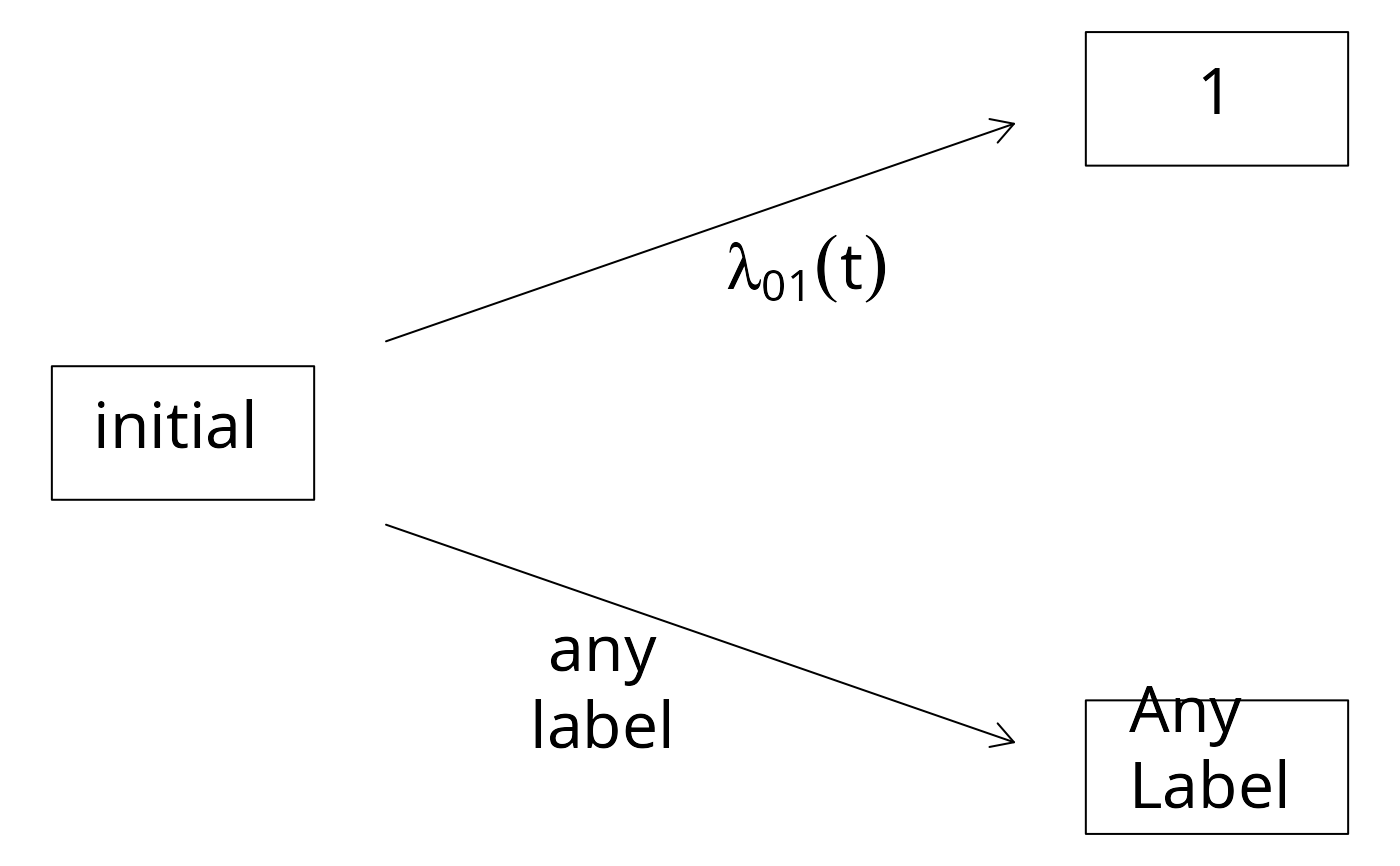
 plot(CRHist,box3.label="Any\nLabel",arrow2.label="any\nlabel")
#> Warning: The dimension of the boxes may depend on the current graphical device
#> in the sense that the layout and centering of text may change when you resize the graphical device and call the same plot.
plot(CRHist,box3.label="Any\nLabel",arrow2.label="any\nlabel")
#> Warning: The dimension of the boxes may depend on the current graphical device
#> in the sense that the layout and centering of text may change when you resize the graphical device and call the same plot.
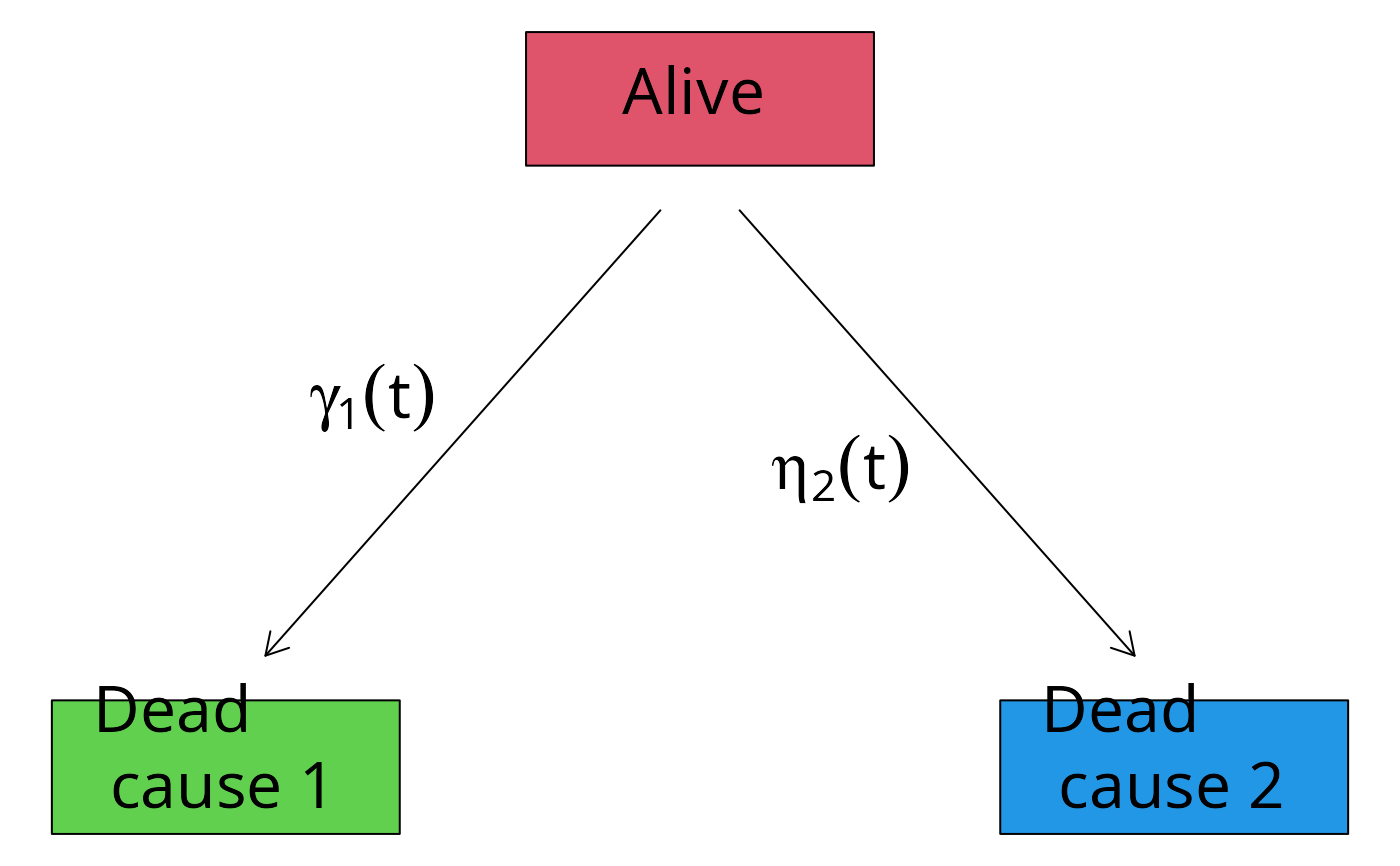
 ## change the layout
plot(CRHist,
box1.label="Alive",
box2.label="Dead\n cause 1",
box3.label="Dead\n cause 2",
arrow1.label=paste(expression(gamma[1](t))),
arrow2.label=paste(expression(eta[2](t))),
box1.col=2,
box2.col=3,
box3.col=4,
nrow=2,
ncol=3,
box1.row=1,
box1.column=2,
box2.row=2,
box2.column=1,
box3.row=2,
box3.column=3)
#> Warning: The dimension of the boxes may depend on the current graphical device
#> in the sense that the layout and centering of text may change when you resize the graphical device and call the same plot.
## change the layout
plot(CRHist,
box1.label="Alive",
box2.label="Dead\n cause 1",
box3.label="Dead\n cause 2",
arrow1.label=paste(expression(gamma[1](t))),
arrow2.label=paste(expression(eta[2](t))),
box1.col=2,
box2.col=3,
box3.col=4,
nrow=2,
ncol=3,
box1.row=1,
box1.column=2,
box2.row=2,
box2.column=1,
box3.row=2,
box3.column=3)
#> Warning: The dimension of the boxes may depend on the current graphical device
#> in the sense that the layout and centering of text may change when you resize the graphical device and call the same plot.
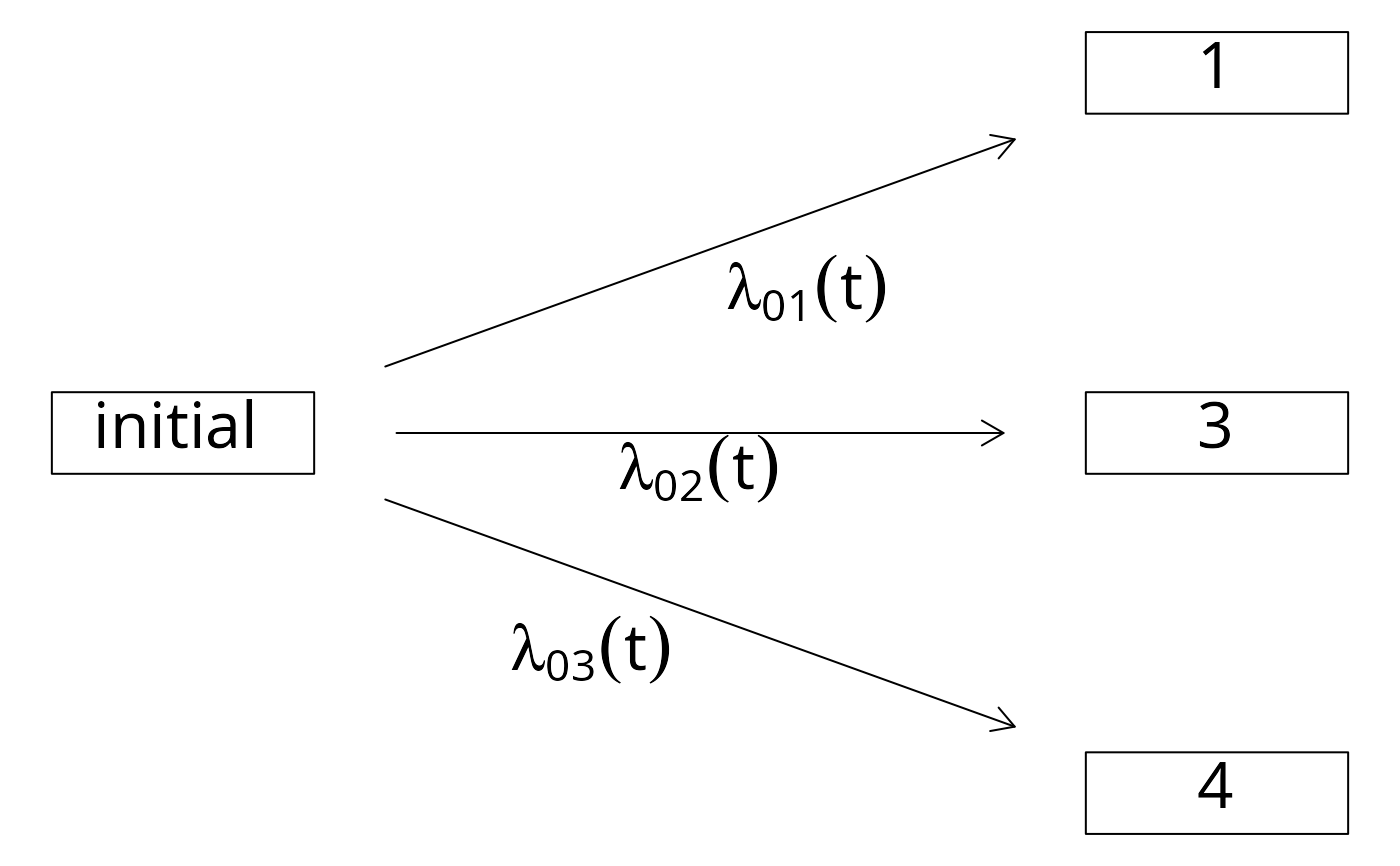
 ## more competing risks
comprisk.model2 <- data.frame(time=1:4,status=1:4)
CRHist2 <- with(comprisk.model2,Hist(time,status,cens.code=2))
plot(CRHist2,box1.row=2)
#> Warning: The dimension of the boxes may depend on the current graphical device
#> in the sense that the layout and centering of text may change when you resize the graphical device and call the same plot.
## more competing risks
comprisk.model2 <- data.frame(time=1:4,status=1:4)
CRHist2 <- with(comprisk.model2,Hist(time,status,cens.code=2))
plot(CRHist2,box1.row=2)
#> Warning: The dimension of the boxes may depend on the current graphical device
#> in the sense that the layout and centering of text may change when you resize the graphical device and call the same plot.
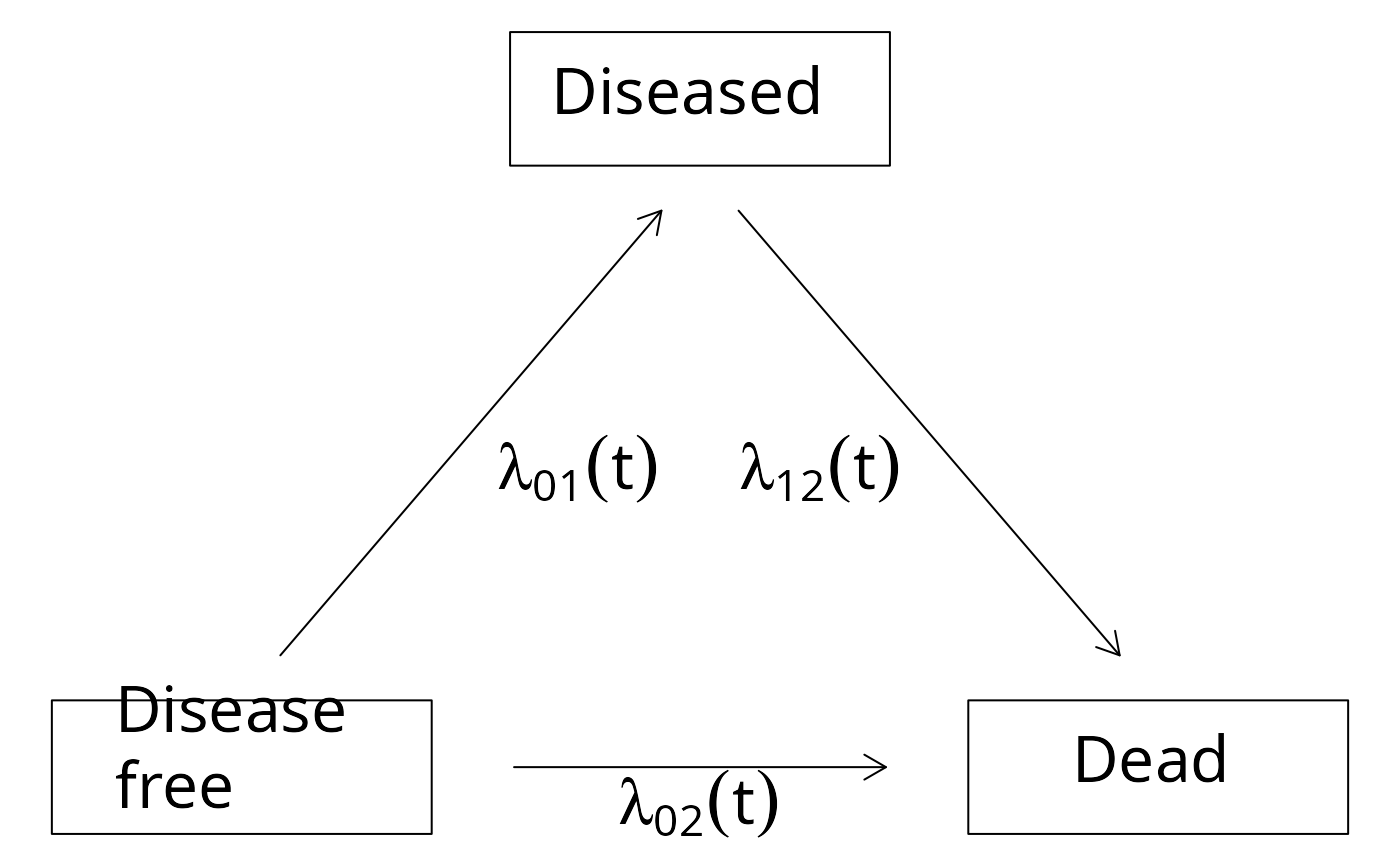
 ## illness-death models
illness.death.frame <- data.frame(time=1:4,
from=c("Disease\nfree",
"Disease\nfree",
"Diseased",
"Disease\nfree"),
to=c("0","Diseased","Dead","Dead"))
IDHist <- with(illness.death.frame,Hist(time,event=list(from,to)))
plot(IDHist)
#> Warning: The dimension of the boxes may depend on the current graphical device
#> in the sense that the layout and centering of text may change when you resize the graphical device and call the same plot.
## illness-death models
illness.death.frame <- data.frame(time=1:4,
from=c("Disease\nfree",
"Disease\nfree",
"Diseased",
"Disease\nfree"),
to=c("0","Diseased","Dead","Dead"))
IDHist <- with(illness.death.frame,Hist(time,event=list(from,to)))
plot(IDHist)
#> Warning: The dimension of the boxes may depend on the current graphical device
#> in the sense that the layout and centering of text may change when you resize the graphical device and call the same plot.
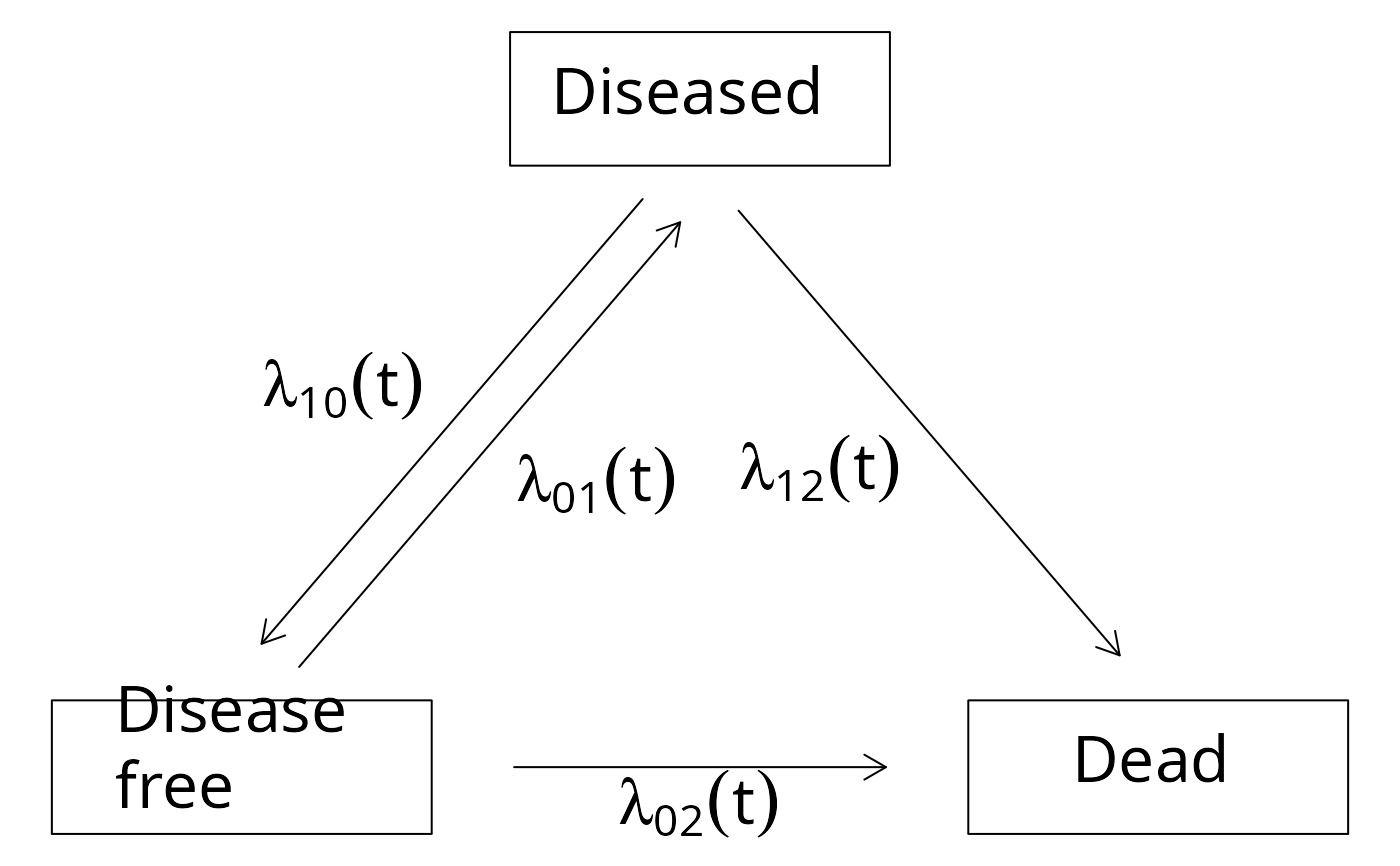
 ## illness-death with recovery
illness.death.frame2 <- data.frame(time=1:5,
from=c("Disease\nfree","Disease\nfree","Diseased","Diseased","Disease\nfree"),
to=c("0","Diseased","Disease\nfree","Dead","Dead"))
IDHist2 <- with(illness.death.frame2,Hist(time,event=list(from,to)))
plot(IDHist2)
#> Warning: The dimension of the boxes may depend on the current graphical device
#> in the sense that the layout and centering of text may change when you resize the graphical device and call the same plot.
## illness-death with recovery
illness.death.frame2 <- data.frame(time=1:5,
from=c("Disease\nfree","Disease\nfree","Diseased","Diseased","Disease\nfree"),
to=c("0","Diseased","Disease\nfree","Dead","Dead"))
IDHist2 <- with(illness.death.frame2,Hist(time,event=list(from,to)))
plot(IDHist2)
#> Warning: The dimension of the boxes may depend on the current graphical device
#> in the sense that the layout and centering of text may change when you resize the graphical device and call the same plot.
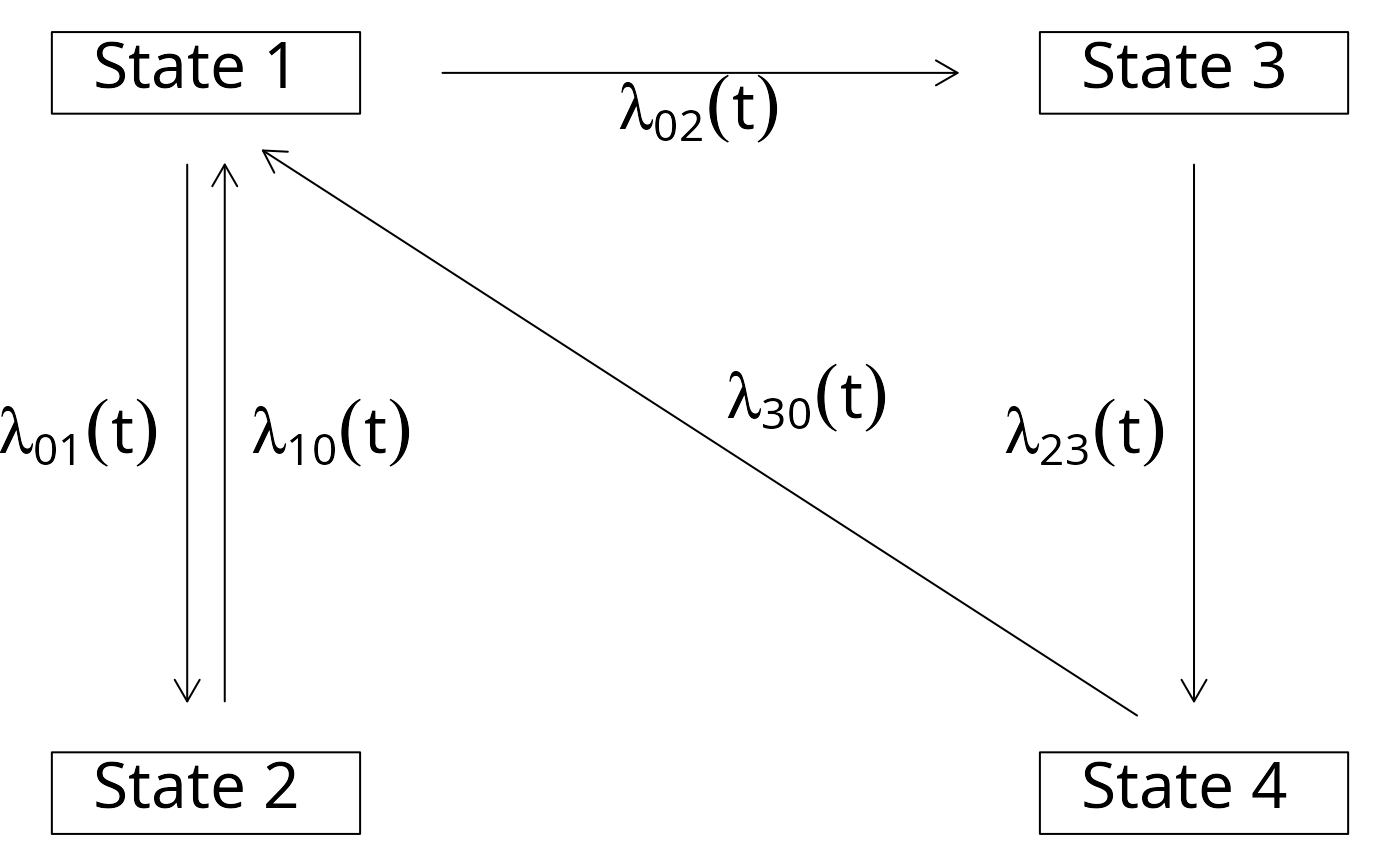
 ## 4 state models
x=data.frame(from=c(1,2,1,3,4),to=c(2,1,3,4,1),time=1:5)
y=with(x,Hist(time=time,event=list(from=from,to=to)))
plot(y)
#> Warning: The dimension of the boxes may depend on the current graphical device
#> in the sense that the layout and centering of text may change when you resize the graphical device and call the same plot.
## 4 state models
x=data.frame(from=c(1,2,1,3,4),to=c(2,1,3,4,1),time=1:5)
y=with(x,Hist(time=time,event=list(from=from,to=to)))
plot(y)
#> Warning: The dimension of the boxes may depend on the current graphical device
#> in the sense that the layout and centering of text may change when you resize the graphical device and call the same plot.
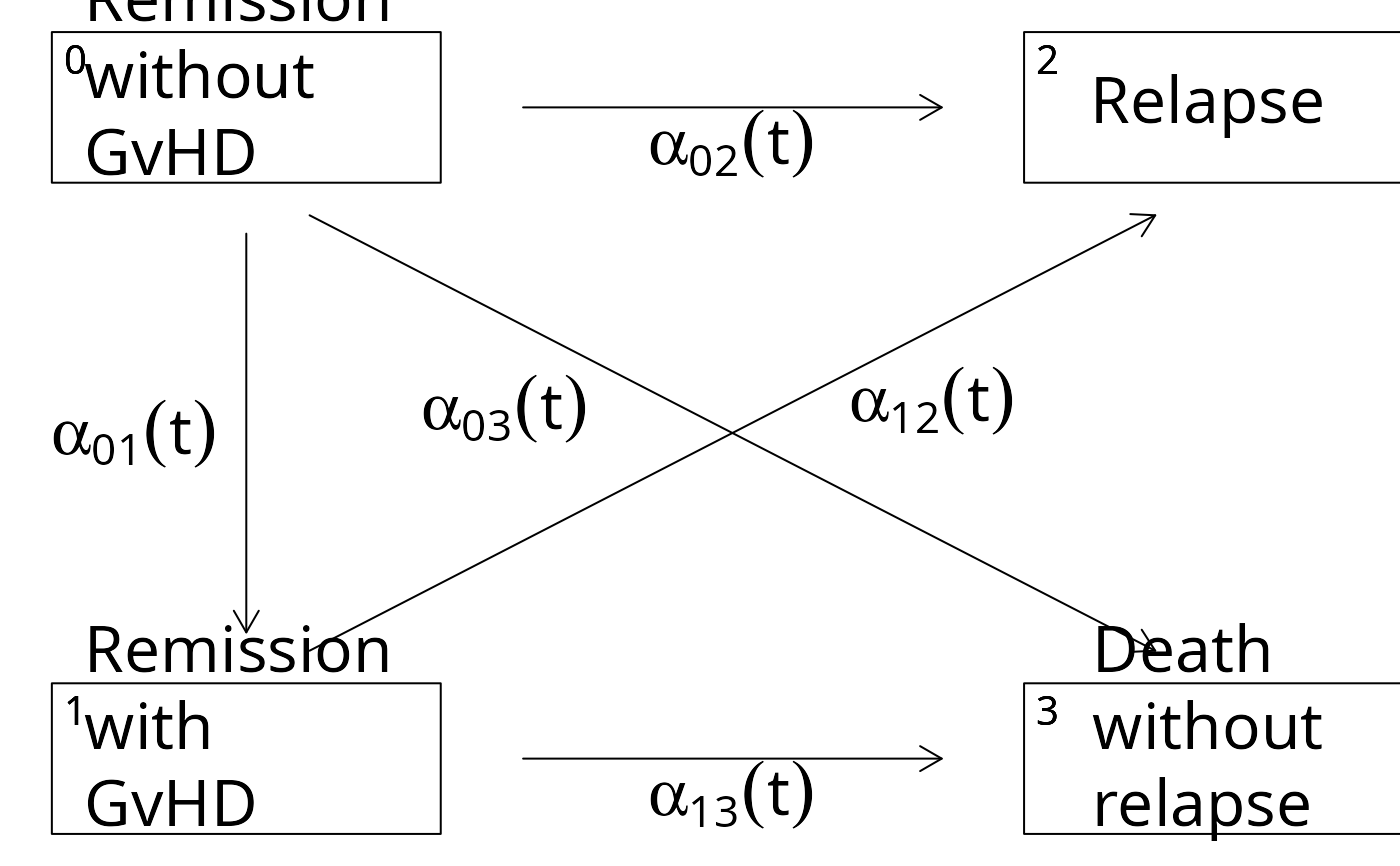
 ## moving the label of some arrows
d <- data.frame(time=1:5,from=c(1,1,1,2,2),to=c(2,3,4,3,4))
h <- with(d,Hist(time,event=list(from,to)))
plot(h,box.padding=c(5,2),
tagBoxes=TRUE,
stateLabels=c("Remission\nwithout\nGvHD",
"Remission\nwith\nGvHD",
"Relapse",
"Death\nwithout\nrelapse"),
arrowLabelSymbol='alpha',
arrowlabel3.x=35,
arrowlabel3.y=53,
arrowlabel4.y=54,
arrowlabel4.x=68)
#> Warning: The dimension of the boxes may depend on the current graphical device
#> in the sense that the layout and centering of text may change when you resize the graphical device and call the same plot.
## moving the label of some arrows
d <- data.frame(time=1:5,from=c(1,1,1,2,2),to=c(2,3,4,3,4))
h <- with(d,Hist(time,event=list(from,to)))
plot(h,box.padding=c(5,2),
tagBoxes=TRUE,
stateLabels=c("Remission\nwithout\nGvHD",
"Remission\nwith\nGvHD",
"Relapse",
"Death\nwithout\nrelapse"),
arrowLabelSymbol='alpha',
arrowlabel3.x=35,
arrowlabel3.y=53,
arrowlabel4.y=54,
arrowlabel4.x=68)
#> Warning: The dimension of the boxes may depend on the current graphical device
#> in the sense that the layout and centering of text may change when you resize the graphical device and call the same plot.
 ##'
##'