Logspline Density Estimation
dlogspline.RdDensity (dlogspline), cumulative probability (plogspline), quantiles
(qlogspline), and random samples (rlogspline) from
a logspline density that was fitted using
the 1997 knot addition and deletion algorithm (logspline).
The 1992 algorithm is available using the oldlogspline function.
dlogspline(q, fit, log = FALSE)
plogspline(q, fit)
qlogspline(p, fit)
rlogspline(n, fit)
Arguments
- q
vector of quantiles. Missing values (NAs) are allowed.
- p
vector of probabilities. Missing values (NAs) are allowed.
- n
sample size. If
length(n)is larger than 1, thenlength(n)random values are returned.- fit
logsplineobject, typically the result oflogspline.- log
should dlogspline return densities (TRUE) or log-densities (FALSE)
Value
Densities (dlogspline), probabilities (plogspline), quantiles (qlogspline),
or a random sample (rlogspline) from a logspline density that was fitted using
knot addition and deletion.
Details
Elements of q or p that are missing will cause the
corresponding elements of the result to be missing.
References
Charles Kooperberg and Charles J. Stone. Logspline density estimation for censored data (1992). Journal of Computational and Graphical Statistics, 1, 301–328.
Charles J. Stone, Mark Hansen, Charles Kooperberg, and Young K. Truong. The use of polynomial splines and their tensor products in extended linear modeling (with discussion) (1997). Annals of Statistics, 25, 1371–1470.
See also
Examples
x <- rnorm(100)
fit <- logspline(x)
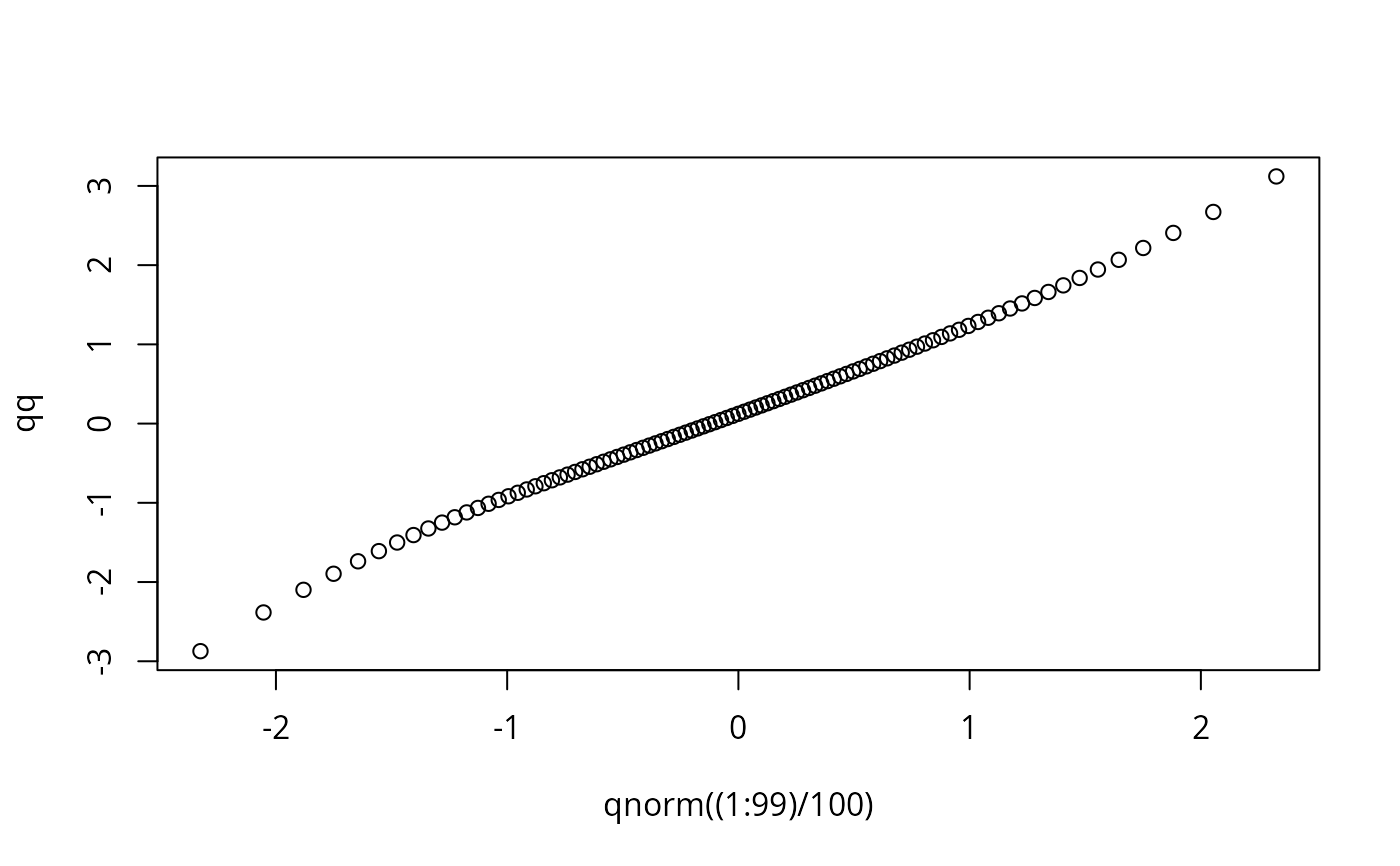
qq <- qlogspline((1:99)/100, fit)
plot(qnorm((1:99)/100), qq) # qq plot of the fitted density
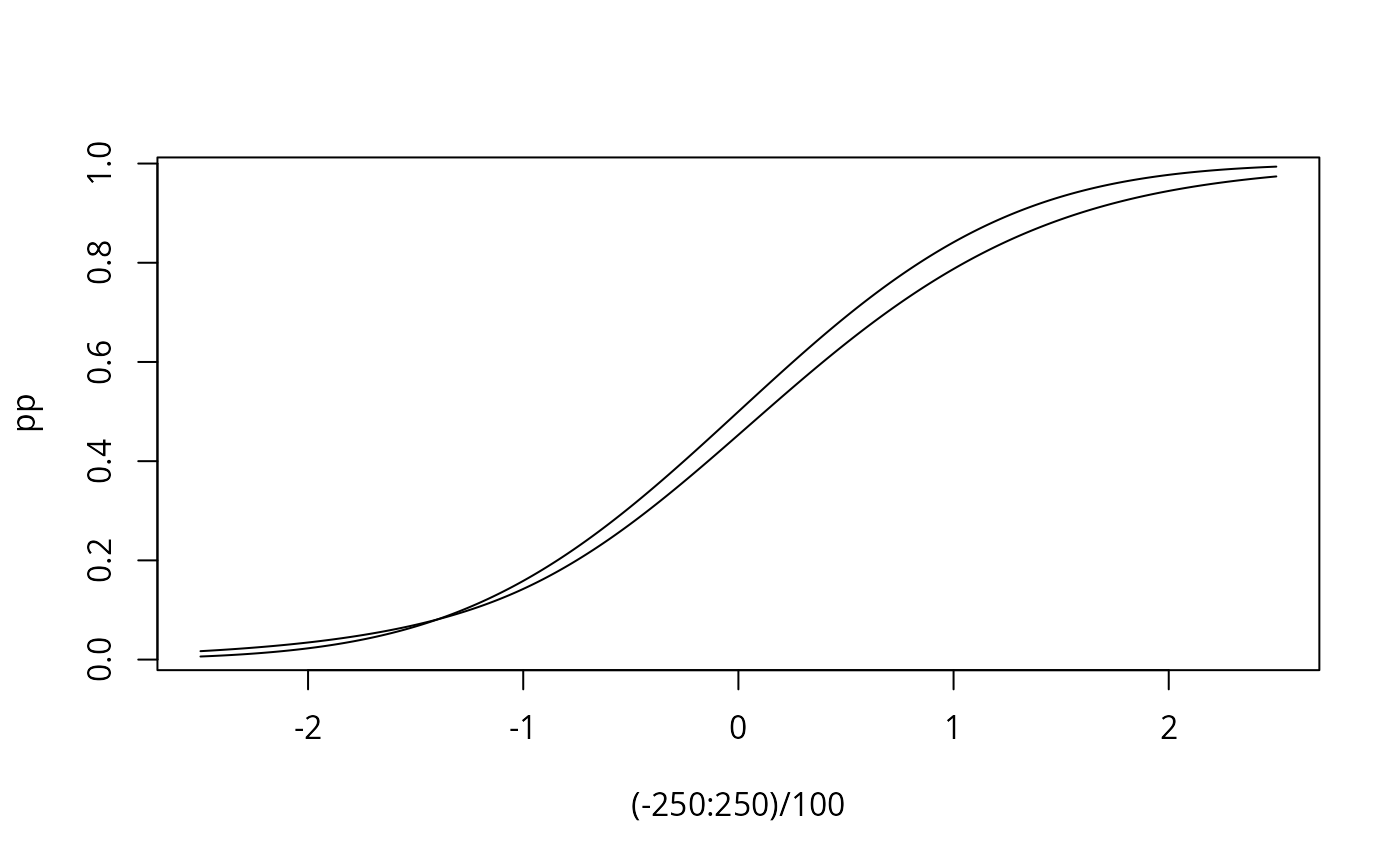
 pp <- plogspline((-250:250)/100, fit)
plot((-250:250)/100, pp, type = "l")
lines((-250:250)/100,pnorm((-250:250)/100)) # asses the fit of the distribution
pp <- plogspline((-250:250)/100, fit)
plot((-250:250)/100, pp, type = "l")
lines((-250:250)/100,pnorm((-250:250)/100)) # asses the fit of the distribution
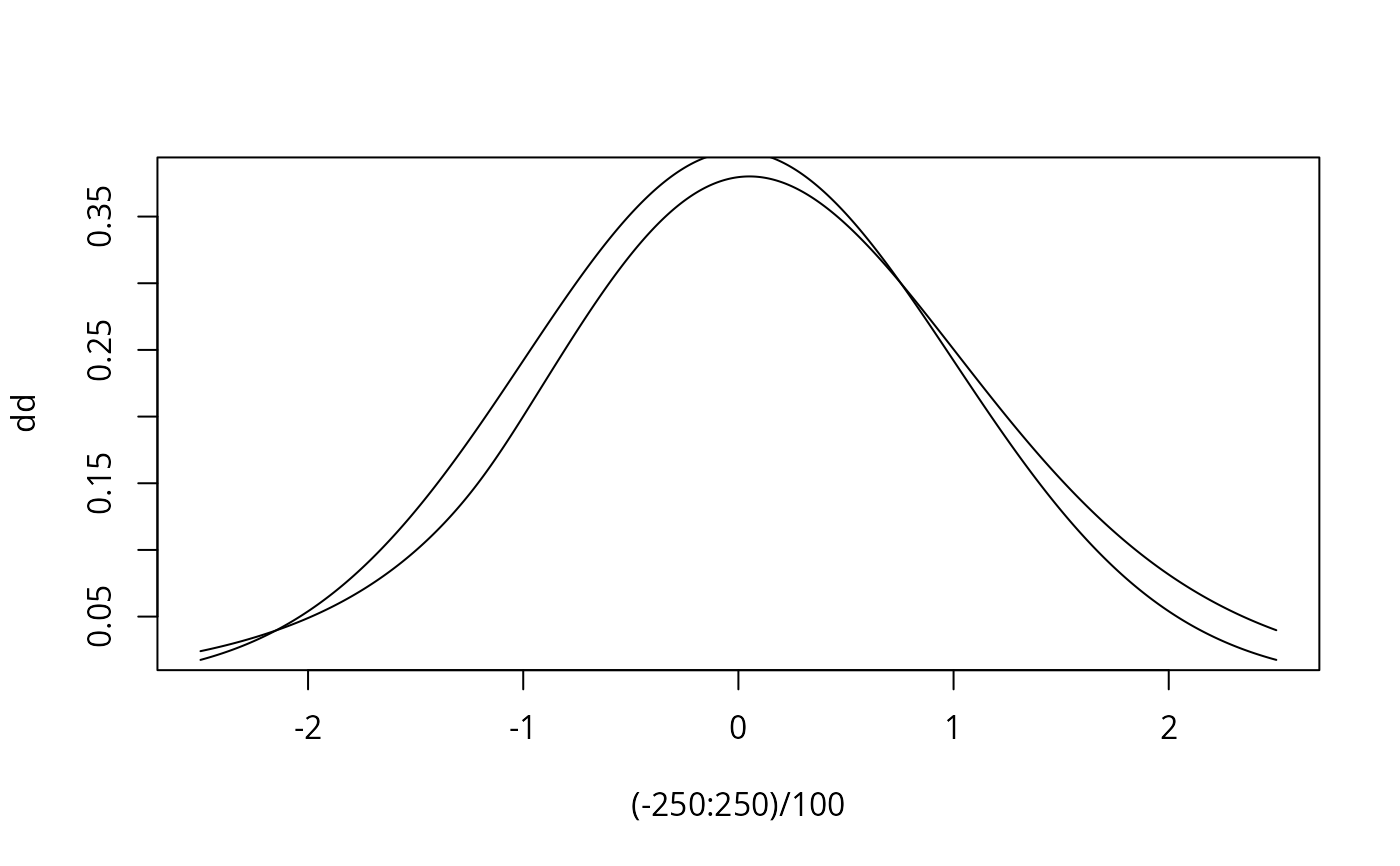
 dd <- dlogspline((-250:250)/100, fit)
plot((-250:250)/100, dd, type = "l")
lines((-250:250)/100, dnorm((-250:250)/100)) # asses the fit of the density
dd <- dlogspline((-250:250)/100, fit)
plot((-250:250)/100, dd, type = "l")
lines((-250:250)/100, dnorm((-250:250)/100)) # asses the fit of the density
 rr <- rlogspline(100, fit) # random sample from fit