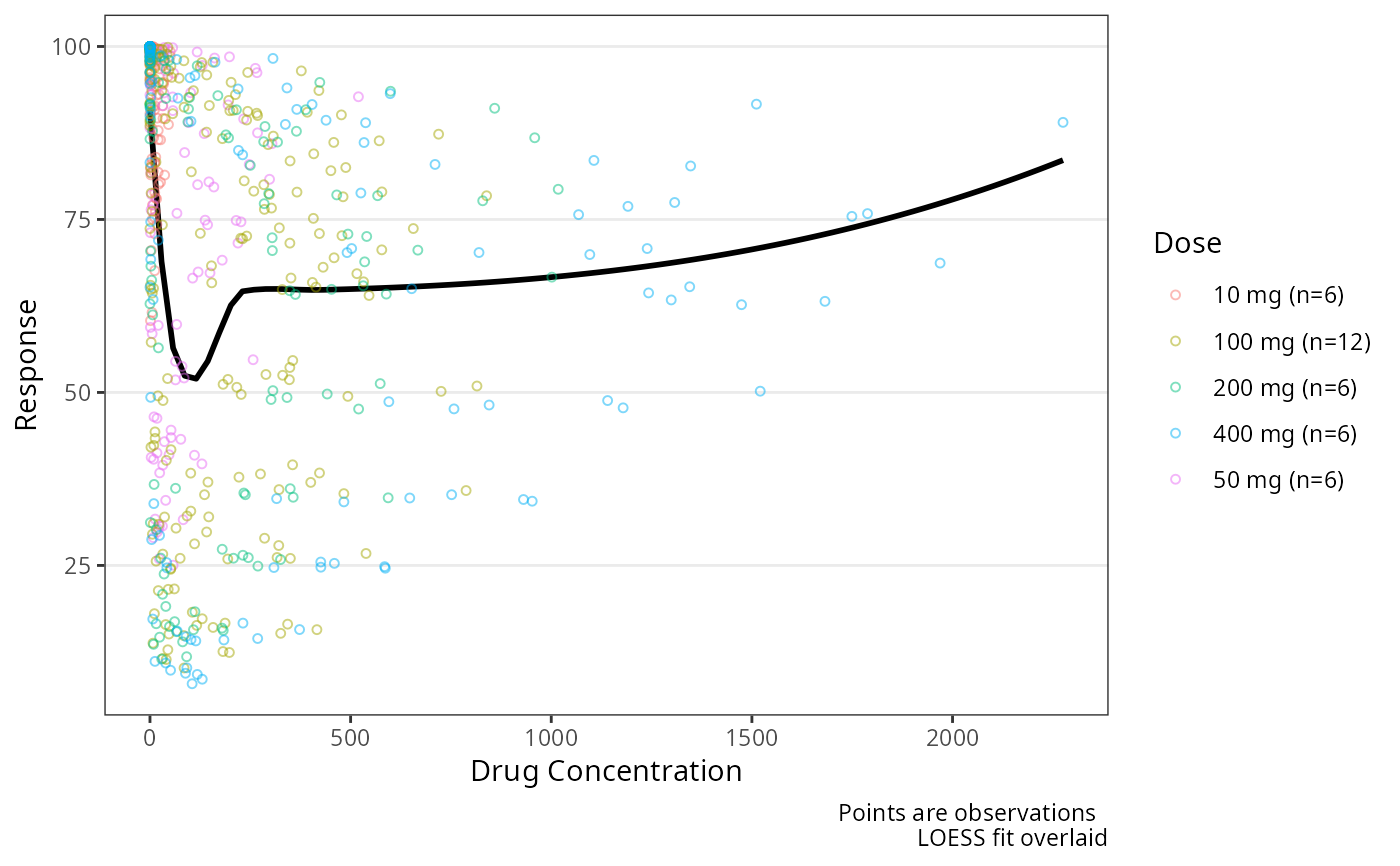
Plot a dependent variable versus concentration
Usage
plot_dvconc(
  data,
  dv_var = DV,
  idv_var = CONC,
  col_var = NULL,
  col_trend = FALSE,
  loess = TRUE,
  linear = FALSE,
  se_loess = FALSE,
  se_linear = FALSE,
  cfb = FALSE,
  cfb_base = 0,
  ylab = "Response",
  xlab = "Drug Concentration",
  log_y = FALSE,
  log_x = FALSE,
  show_caption = TRUE,
  theme = NULL,
  ...
)
Arguments
- data
Input dataset.
- dv_var
Column containing the DV variable in
data. Accepts bare names or strings.- idv_var
Independent variable column. Accepts bare names or strings. Default is
CONC.- col_var
Column to map to the color aesthetic. Accepts bare names or strings. Default is
NULL.- col_trend
Logical indicating if the variable specified in
col_varshould be used to stratify trend lines- loess
Logical indicating if a loess smoother fit should be shown. Default is
TRUE- linear
Logical indicating if a linear regression fit should be shown. Default is
FALSE.- se_loess
Logical indicating if the standard error should be shown for the loess fit. Default is
FALSE- se_linear
Logical indicating if the standard error should be shown for the linear fit. Default is
FALSE- cfb
Logical indicating if dependent variable is a change from baseline. Plots a reference line at y = cfb_baseline. Default is
FALSE.- cfb_base
Value for y-intercept when cfb =
TRUE. Default is 0.- ylab
Character string specifying the y-axis label: Default is
"Response".- xlab
Character string specifying the x-axis label: Default is
"Drug Concentration"- log_y
Logical indicator for log10 transformation of the y-axis.
- log_x
Logical indicator for log10 transformation of the x-axis.
- show_caption
Logical indicating if a caption should be show describing the data plotted
- theme
Named list of aesthetic parameters to be supplied to the plot. Defaults can be viewed by running
plot_dvconc_theme()with no arguments.- ...
Additional arguments passed to
geom_smooth()