Scatterplot to Compare two Variables
compPlot.RdPlot a scatterplot to compare two variables.
Arguments
- x
values of the first variable (on the X axis).
- y
values of the second variable (on the Y axis).
- lim
optional vector of two elements specifying the limits of both axes).
- ...
further arguments are passed to
plot.
Examples
set.seed( 123 )
x <- runif( 25 )
y <- 2 + 3 * x + rnorm( 25 )
ols <- lm( y ~ x )
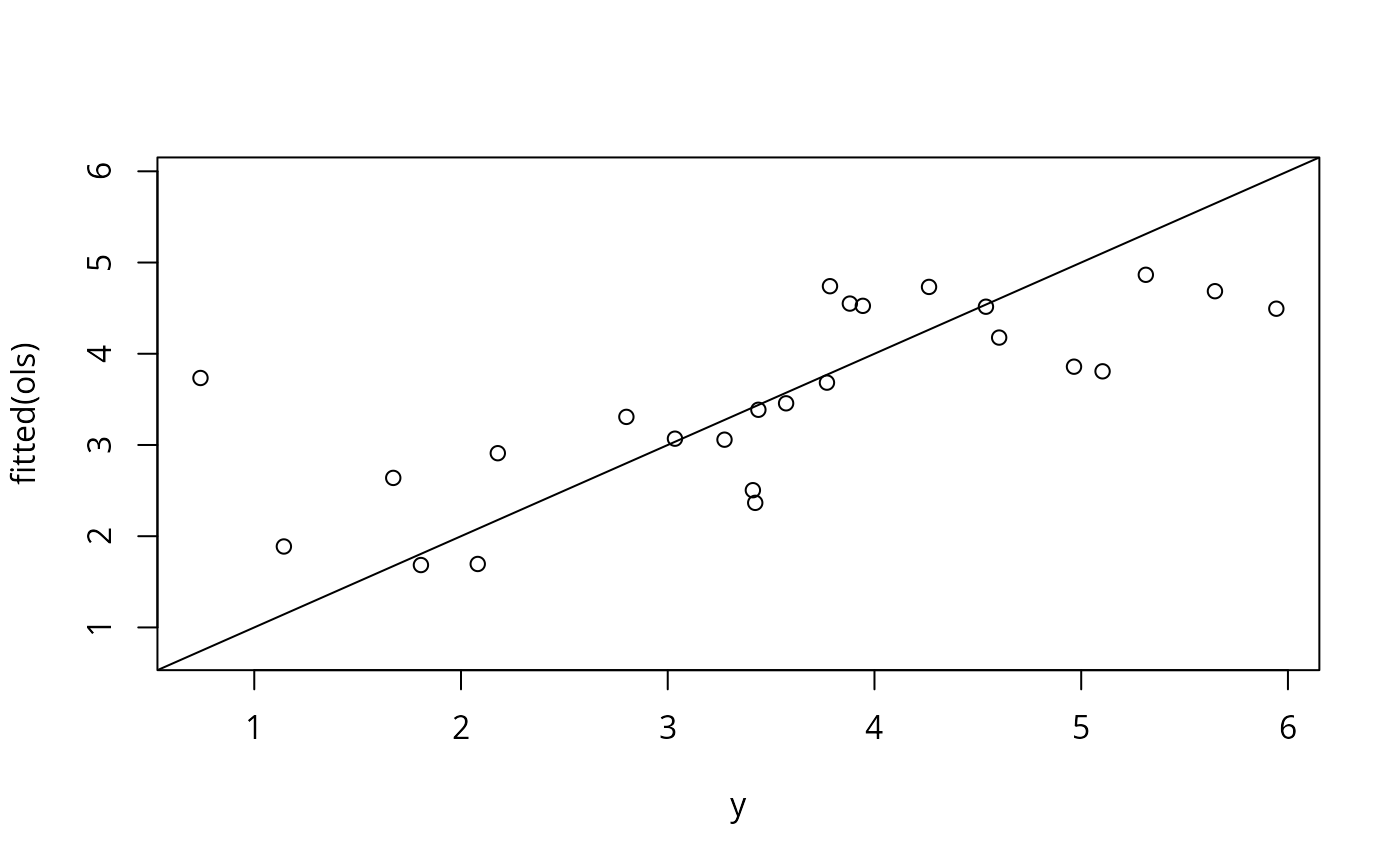
compPlot( y, fitted( ols ) )
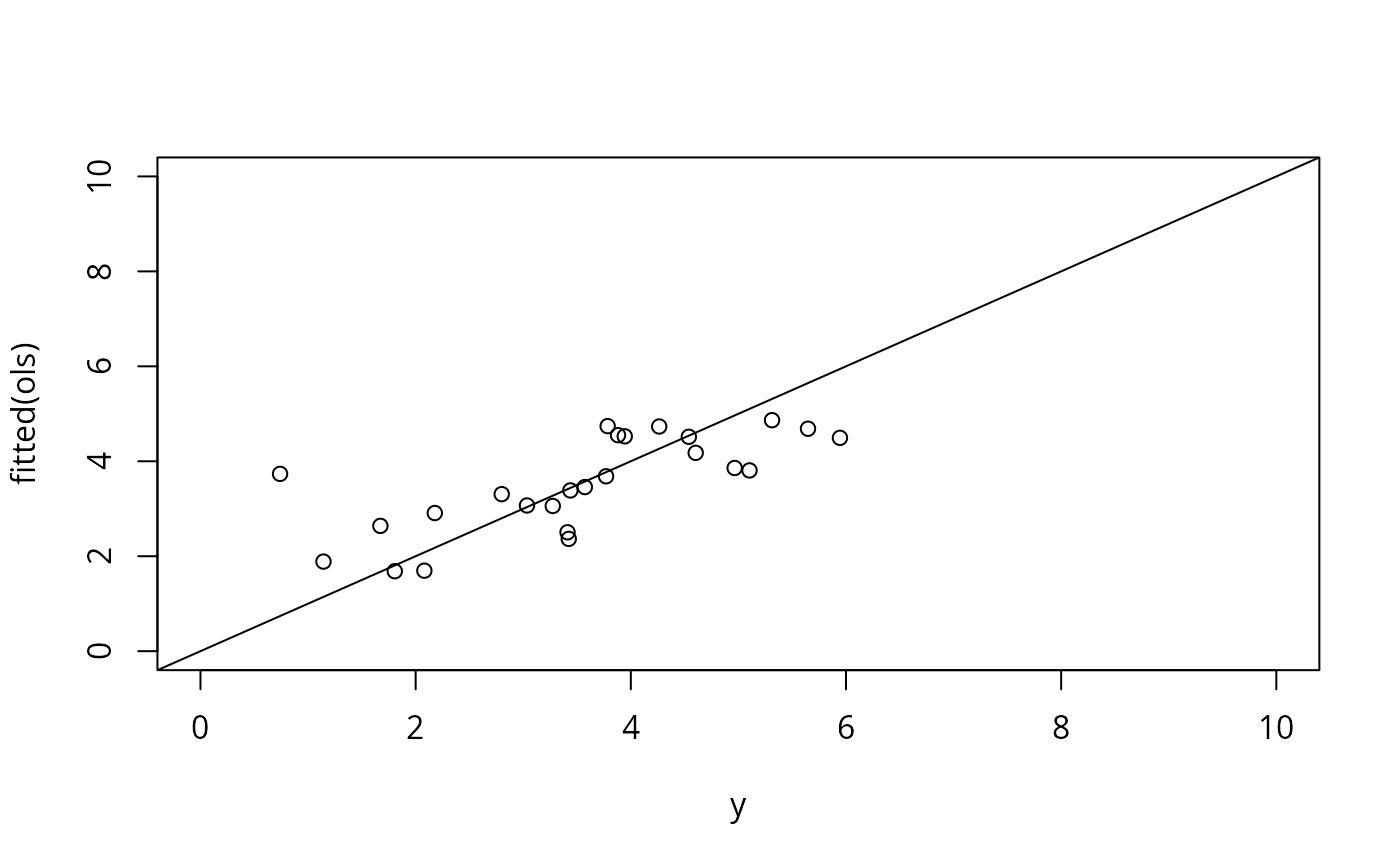
 compPlot( y, fitted( ols ), lim = c( 0, 10 ) )
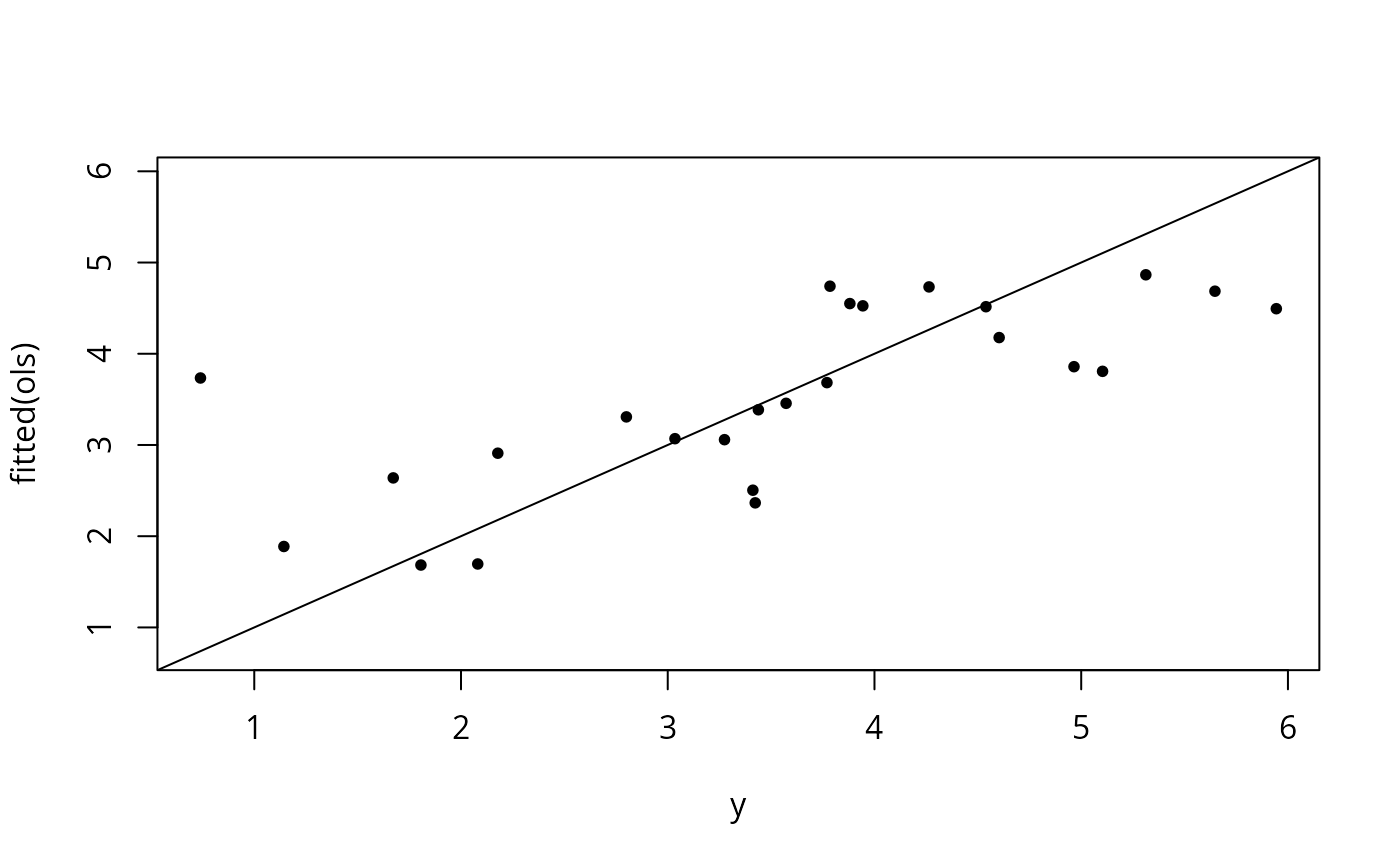
 compPlot( y, fitted( ols ), pch = 20 )
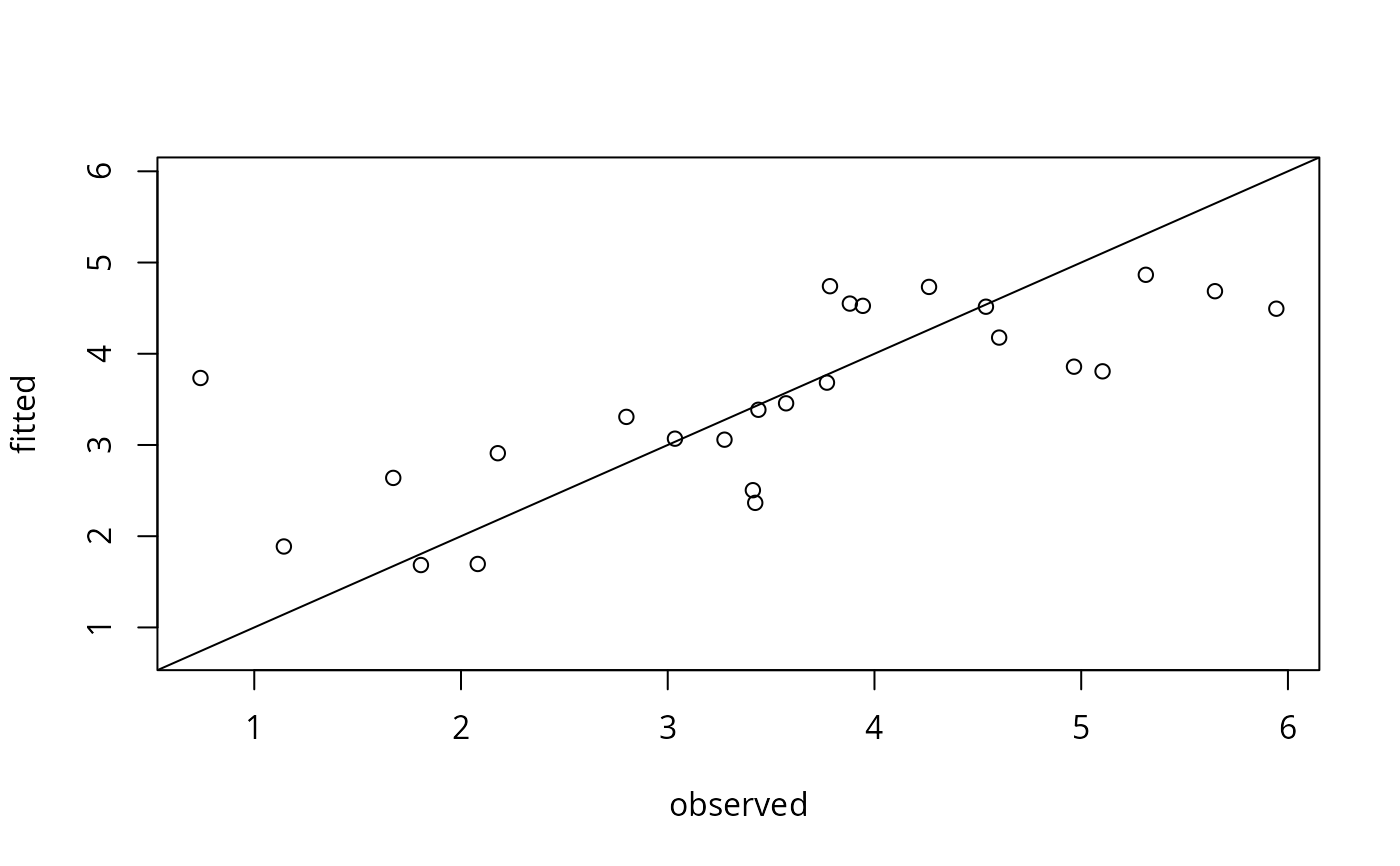
 compPlot( y, fitted( ols ), xlab = "observed", ylab = "fitted" )
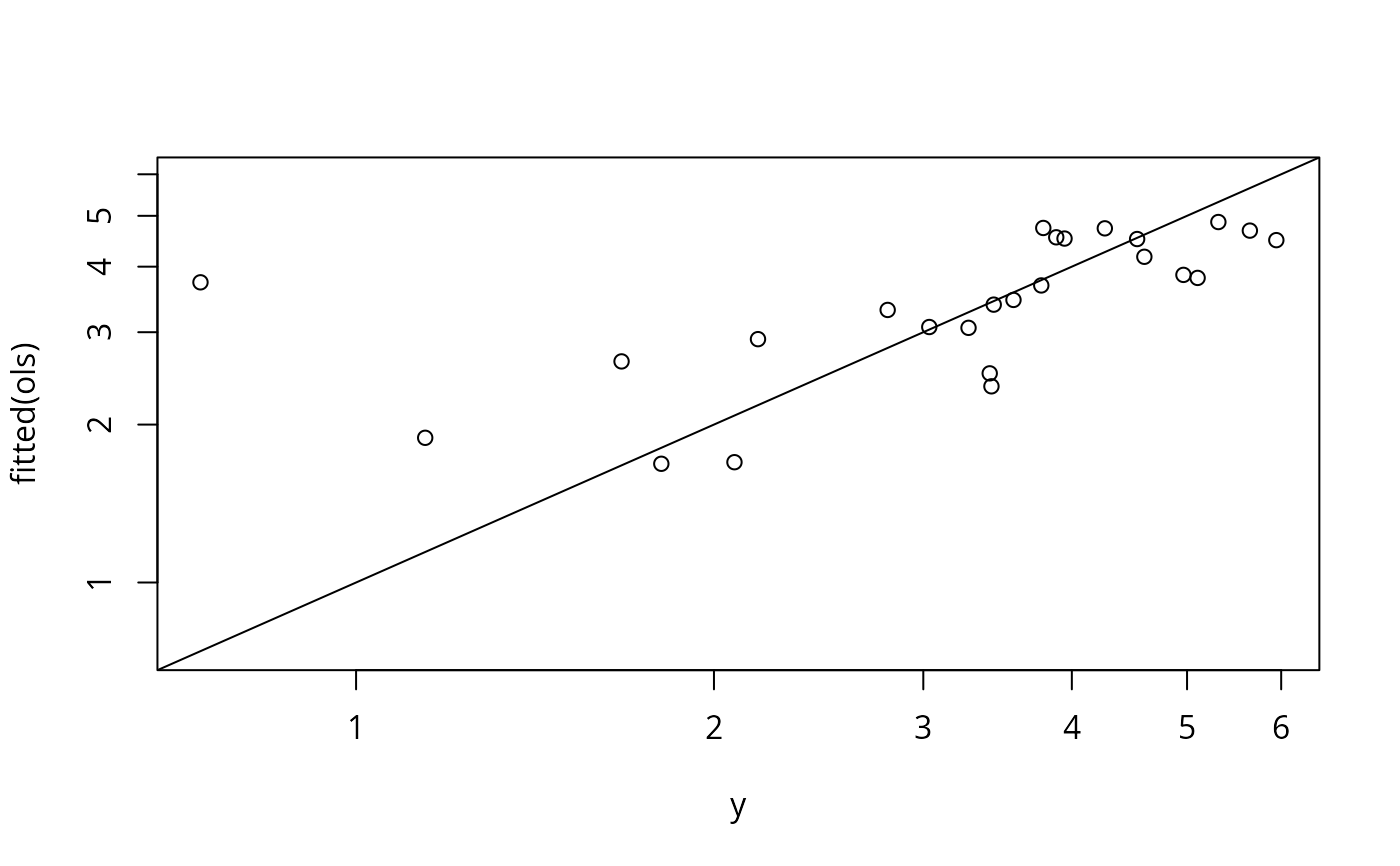
 compPlot( y, fitted( ols ), log = "xy" )