histDens.Rd
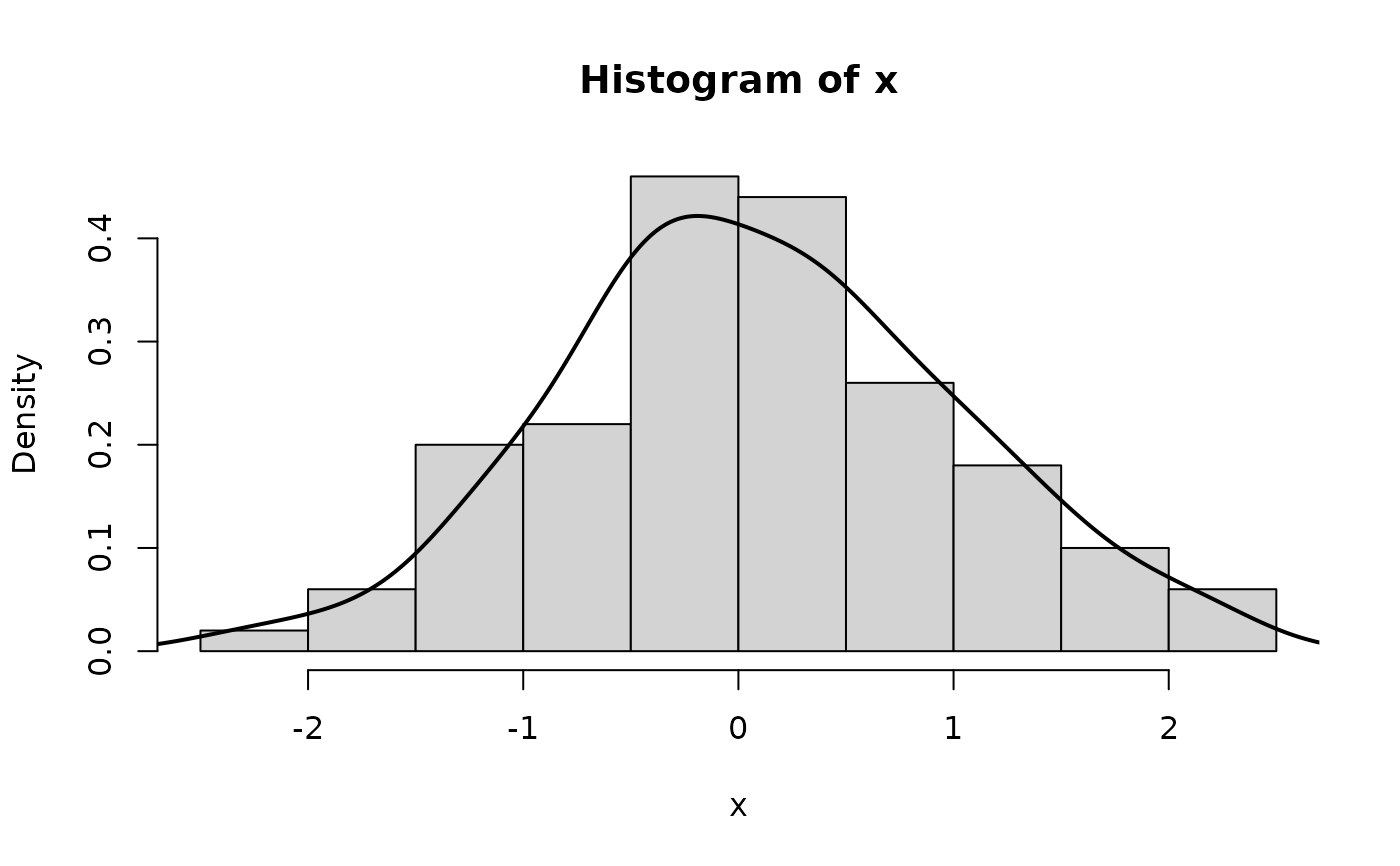
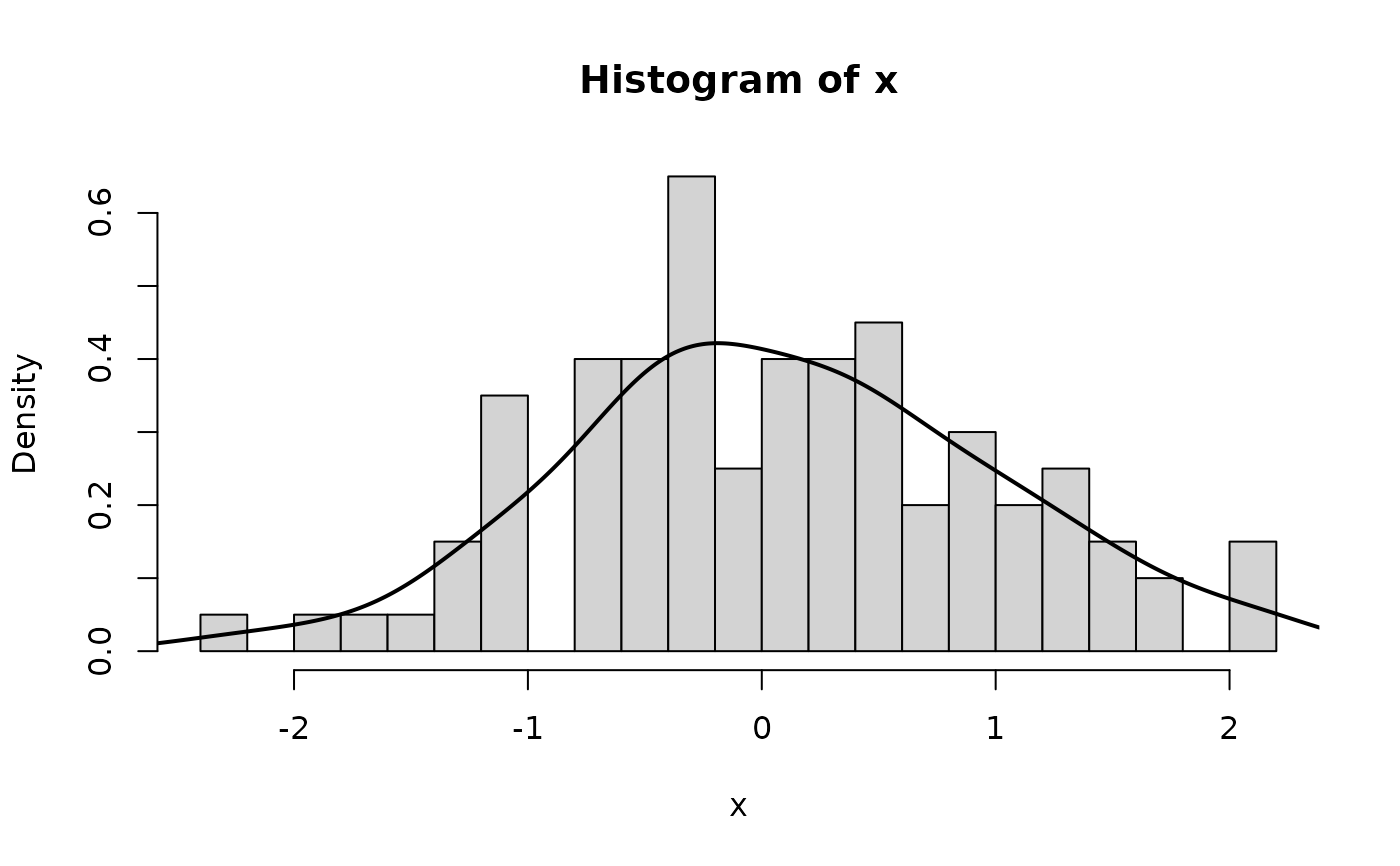
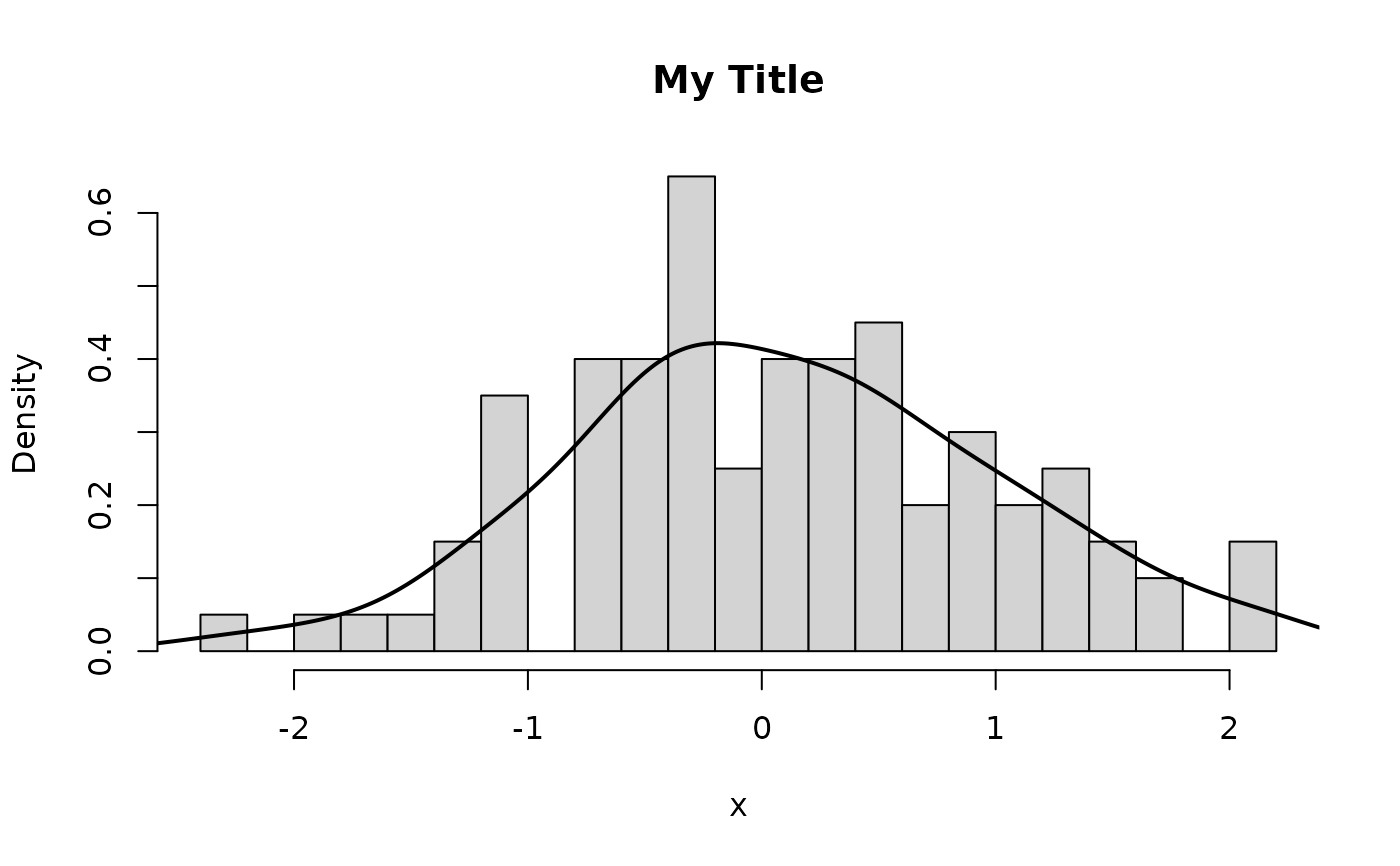
Plot a histrogram and add a kernel density line.
histDens( x, breaks = "Sturges", ... )
values of the variable.
passed to hist.
hist
further arguments are passed to hist.
Arne Henningsen
   set.seed( 123 )
   x <- rnorm( 100 )
   histDens( x )

   histDens( x, 20 )

   histDens( x, 20, main = "My Title" )