Plotting the Relative Jackknife Influence Function
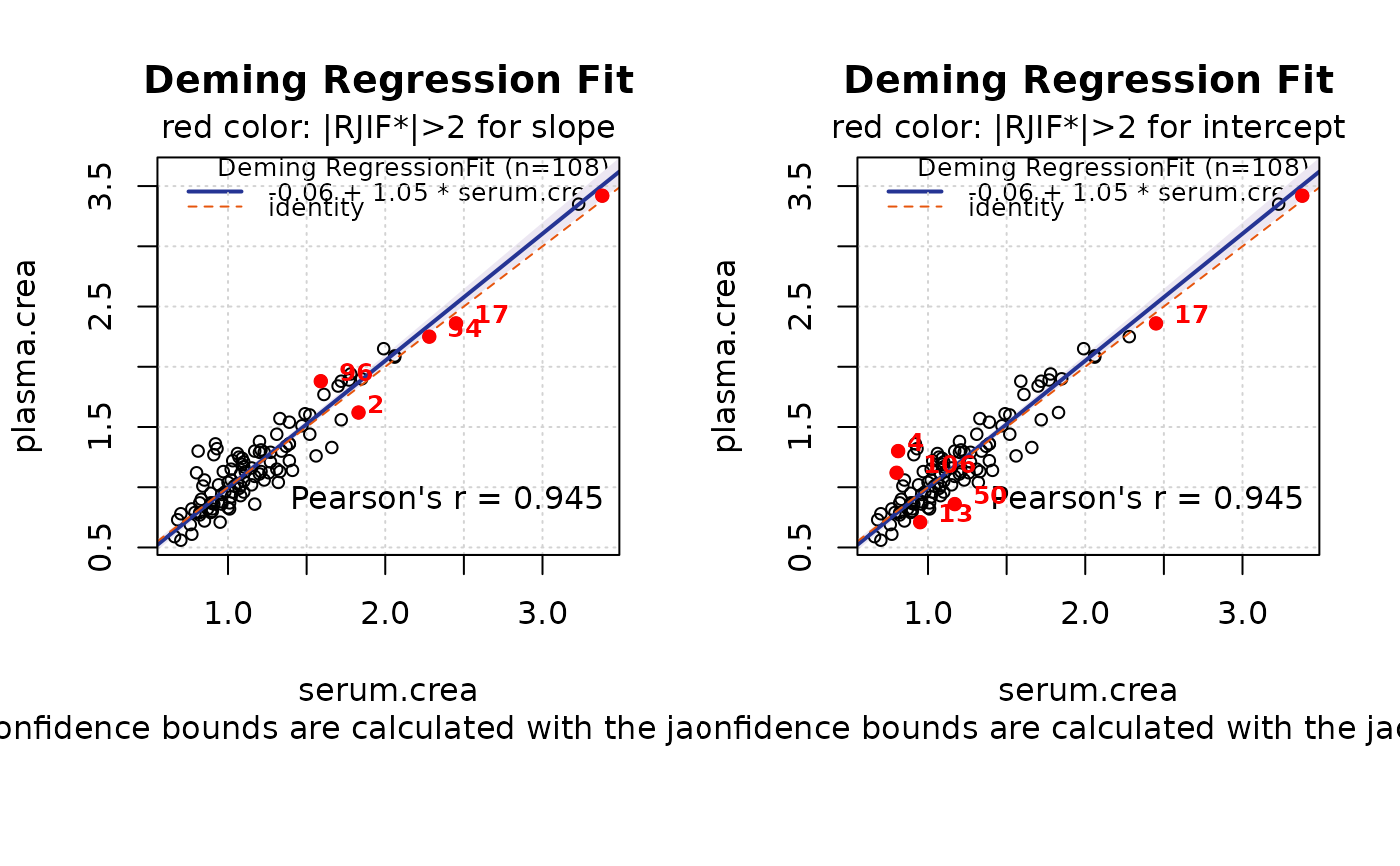
MCResultJackknife.plotwithRJIF.RdThe function draws reference method vs. test method as scatter plot. Observations with high influence (relative jackknife influence function is greater than 2) are highlighted as red points.
MCResultJackknife.plotwithRJIF(.Object)Value
No return value
References
Efron, B. (1990) Jackknife-After-Bootstrap Standard Errors and Influence Functions. Technical Report , N 134.
Examples
    #library("mcr")
    data(creatinine,package="mcr")
    x <- creatinine$serum.crea
    y <- creatinine$plasma.crea
    # Deming regression fit.
    # The confidence intervals for regression coefficients
    # are calculated with jackknife method
    model <- mcreg( x,y,error.ratio=1,method.reg="Deming", method.ci="jackknife",
                     mref.name = "serum.crea", mtest.name = "plasma.crea", na.rm=TRUE )
#> Please note:
#> 2 of 110 observations contain missing values and have been removed.
#> Number of data points in analysis is 108.
#> Jackknife based calculation of standard error and confidence intervals according to Linnet's method.
    plotwithRJIF(model)