twCoefLogitnormN
twCoefLogitnormN.RdEstimating coefficients from a vector of quantiles and percentiles (non-vectorized).
Arguments
- quant
the quantile values
- perc
the probabilities for which the quantiles were specified
- method
method of optimization (see
optim)- theta0
starting parameters
- returnDetails
if TRUE, the full output of optim is returned instead of only entry par
- ...
further parameters passed to optim, e.g.
control = list(maxit = 1000)
Value
named numeric vector with estimated parameters of the logitnormal distribution.
names: c("mu","sigma")
See also
Examples
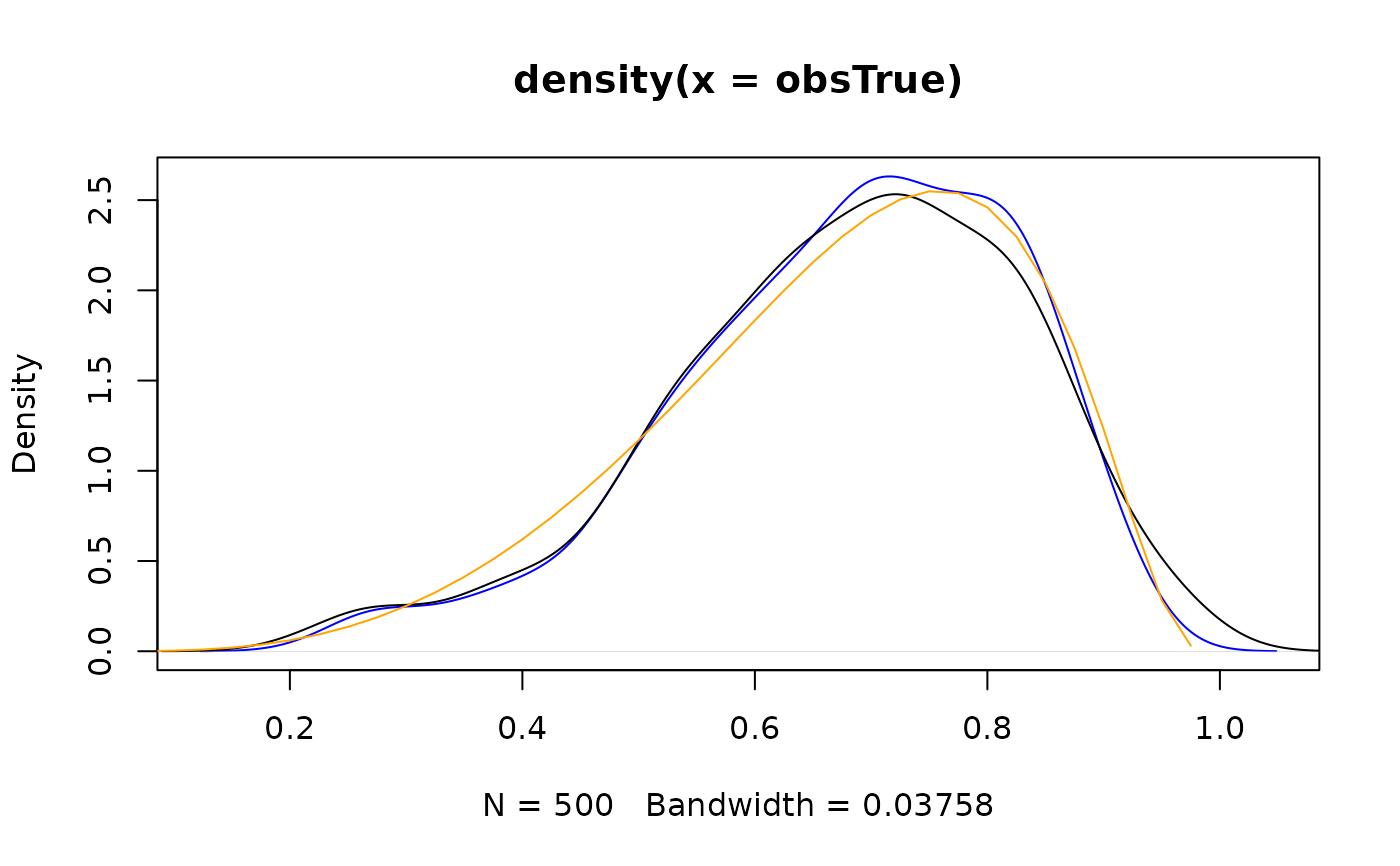
# experiment of re-estimation the parameters from generated observations
thetaTrue <- c(mu = 0.8, sigma = 0.7)
obsTrue <- rlogitnorm(thetaTrue["mu"],thetaTrue["sigma"], n = 500)
obs <- obsTrue + rnorm(100, sd = 0.05)        # some observation uncertainty
plot(density(obsTrue),col = "blue"); lines(density(obs))

# re-estimate parameters based on the quantiles of the observations
(theta <- twCoefLogitnorm( median(obs), quantile(obs,probs = 0.9), perc = 0.9))
#>        mu sigma.90%
#> 0.8255915 0.7859063

# add line of estimated distribution
x <- seq(0,1,length.out = 41)[-c(1,41)]  # plotting grid
dx <- dlogitnorm(x,mu = theta[1],sigma = theta[2])
lines( dx ~ x, col = "orange")