Plots a graph in R.
lav_plotinfo_rgraph.RdCreates a graph in R showing a simple diagram of the model.
Usage
lav_plotinfo_rgraph(plotinfo,
                    sloped.labels = TRUE,
                    outfile = "",
                    addgrid = TRUE,
                    mlovcolors = c("lightgreen", "lightblue"),
                    lightness = 1,
                    italic = TRUE,
                    auto.subscript = TRUE
                   )
Arguments
- plotinfo
A plotinfo structure as returned from
lav_plotinfo_positions.- sloped.labels
Logical, sloped labels above (or under) the edges.
- outfile
Character string naming the file to store the diagram in PNG or NA to show the plot in R.
- addgrid
Logical, add a grid with indicated 'positions' to the graph?
- mlovcolors
Array of two colors for distinguishing ov nodes with same name between the levels in a multilevel model.
- lightness
A scalar factor to modify the distances between nodes.
- italic
Are labels to be in italic font? Attention: The switch to an italic font will only be possible if the label value isn't an expression!
- auto.subscript
Logical, see
lav_label_code.
Examples
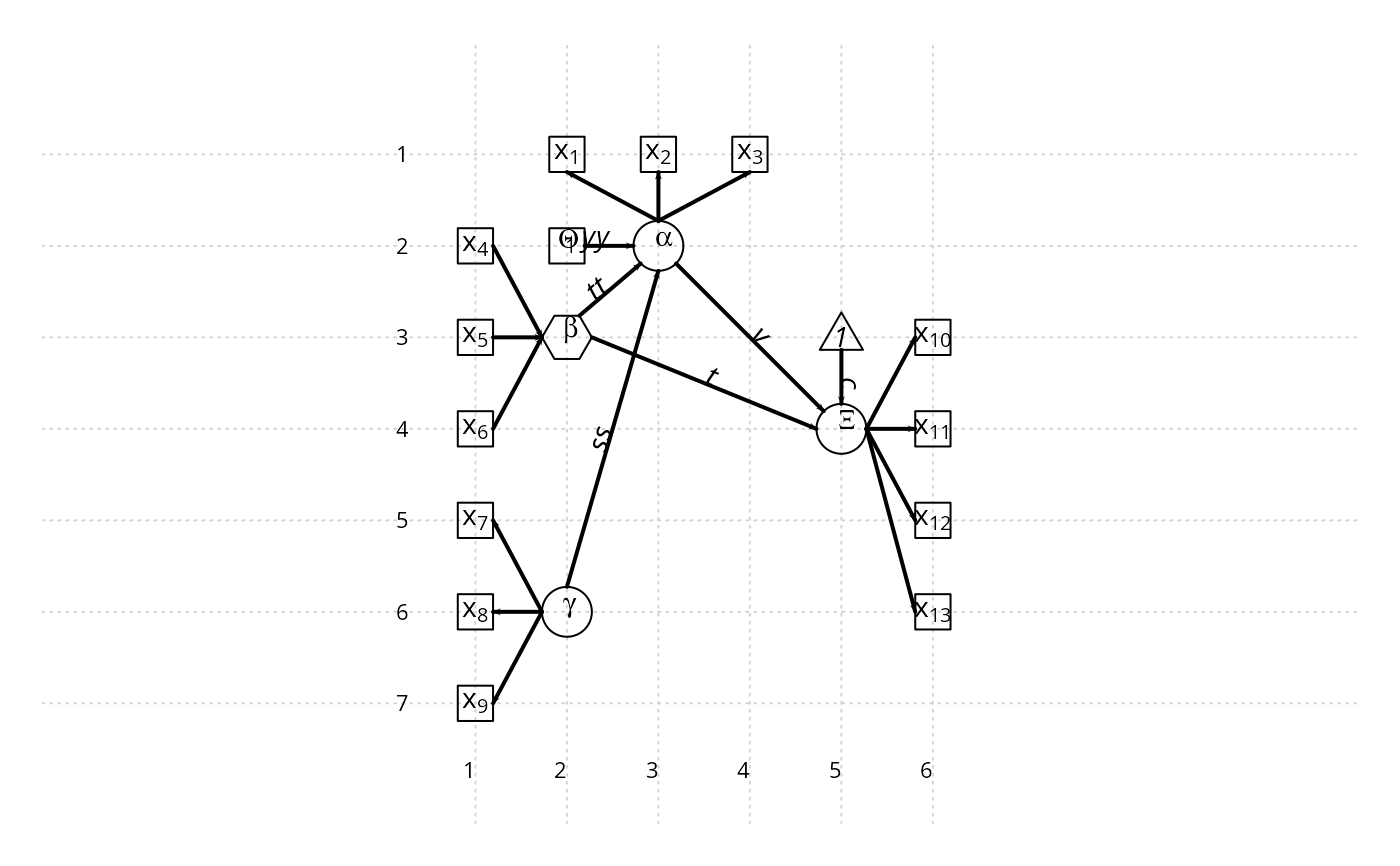
model <- 'alpha =~ x1 + x2 + x_3 # latent variable
beta <~ x4 + x5 + x6 # composite
gamma =~ x7 + x8 + x9 # latent variable
Xi =~ x10 + x11 + x12 + x13 # latent variable
# regressions
Xi ~ v * alpha + t * beta + c * 1
alpha ~ yy * Theta1 + tt * beta + ss * gamma
'
test <- lav_model_plotinfo(model)
test1 <- lav_plotinfo_positions(test)
lav_plotinfo_rgraph(test1, lightness = 1.1)
 # better position for constant in regressen Xi, no sloped labels
test2 <- lav_plotinfo_positions(test, placenodes = list(`1vanXi` = c(2, 5)))
lav_plotinfo_rgraph(test2, FALSE, lightness = 1.1)
# better position for constant in regressen Xi, no sloped labels
test2 <- lav_plotinfo_positions(test, placenodes = list(`1vanXi` = c(2, 5)))
lav_plotinfo_rgraph(test2, FALSE, lightness = 1.1)
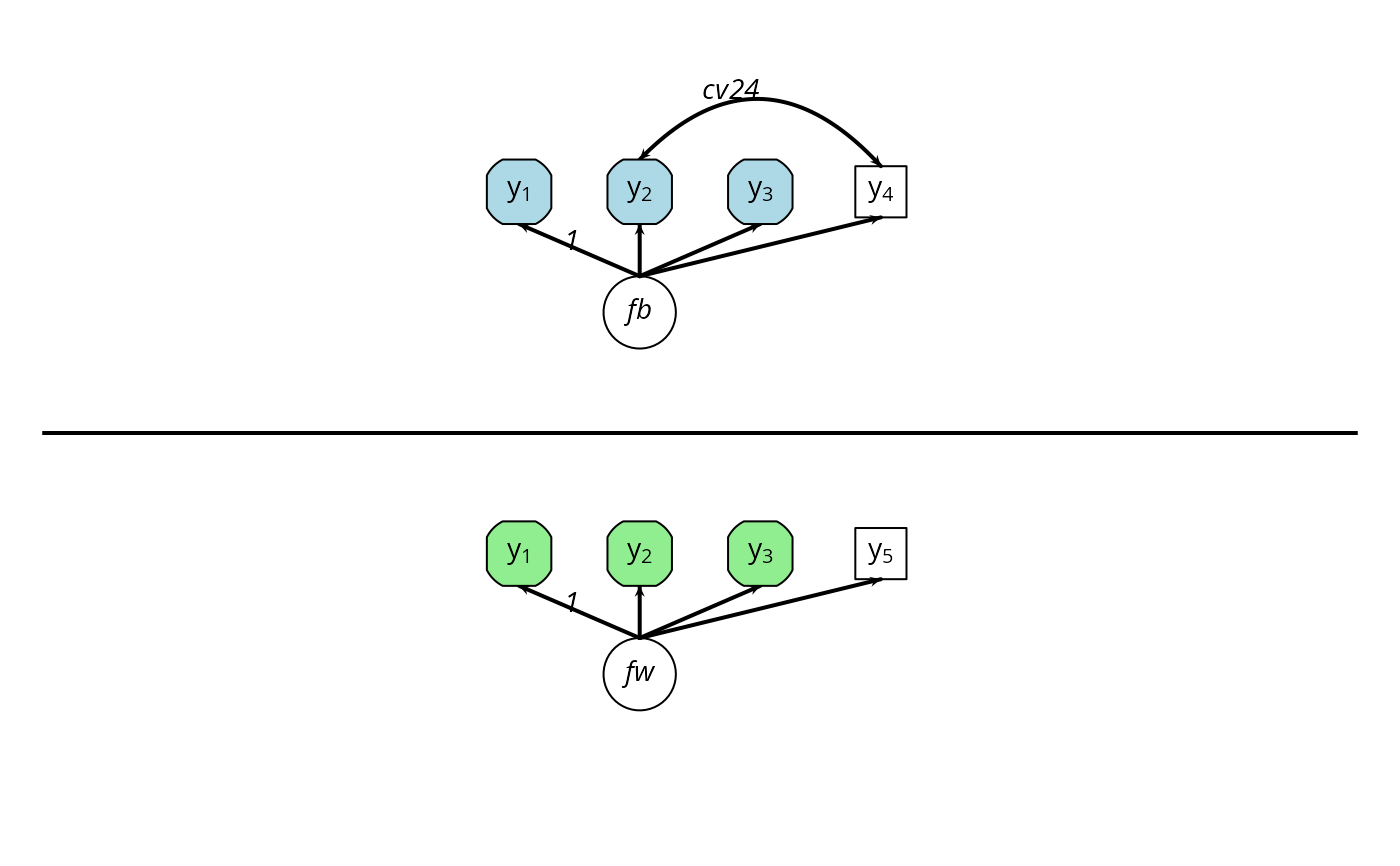
 modelml <- '
level: 1
fw =~ 1*y_1 + y_2 + y_3 + y_5
level: 2
fb =~ 1*y_1 + y_2 + y_3 + y_4
y_2 ~~ cv24 * y_4
'
test <- lav_model_plotinfo(modelml)
test <- lav_plotinfo_positions(test)
lav_plotinfo_rgraph(test, sloped.labels = FALSE, addgrid = FALSE,
auto.subscript = FALSE)
modelml <- '
level: 1
fw =~ 1*y_1 + y_2 + y_3 + y_5
level: 2
fb =~ 1*y_1 + y_2 + y_3 + y_4
y_2 ~~ cv24 * y_4
'
test <- lav_model_plotinfo(modelml)
test <- lav_plotinfo_positions(test)
lav_plotinfo_rgraph(test, sloped.labels = FALSE, addgrid = FALSE,
auto.subscript = FALSE)
 if (FALSE) { # \dontrun{
# example where plot is stored in a PNG file
lav_plotinfo_rgraph(test, sloped.labels = FALSE, addgrid = FALSE,
auto.subscript = FALSE, outfile="demo_rplot.png")
} # }
if (FALSE) { # \dontrun{
# example where plot is stored in a PNG file
lav_plotinfo_rgraph(test, sloped.labels = FALSE, addgrid = FALSE,
auto.subscript = FALSE, outfile="demo_rplot.png")
} # }