Default Panel Function for barchart
panel.barchart.RdDefault panel function for barchart.
Usage
panel.barchart(x, y, box.ratio = 1, box.width,
               horizontal = TRUE,
               origin = NULL, reference = TRUE,
               stack = FALSE,
               groups = NULL,
               col = if (is.null(groups)) plot.polygon$col
                     else superpose.polygon$col,
               border = if (is.null(groups)) plot.polygon$border
                        else superpose.polygon$border,
               lty = if (is.null(groups)) plot.polygon$lty
                     else superpose.polygon$lty,
               lwd = if (is.null(groups)) plot.polygon$lwd
                     else superpose.polygon$lwd,
               ..., identifier = "barchart")
Arguments
- x
Extent of Bars. By default, bars start at left of panel, unless
originis specified, in which case they start there.- y
Horizontal location of bars. Possibly a factor.
- box.ratio
Ratio of bar width to inter-bar space.
- box.width
Thickness of bars in absolute units; overrides
box.ratio. Useful for specifying thickness when the categorical variable is not a factor, as use ofbox.ratioalone cannot achieve a thickness greater than 1.- horizontal
Logical flag. If FALSE, the plot is ‘transposed’ in the sense that the behaviours of x and y are switched. x is now the ‘factor’. Interpretation of other arguments change accordingly. See documentation of
bwplotfor a fuller explanation.- origin
The origin for the bars. For grouped displays with
stack = TRUE, this argument is ignored and the origin set to 0. Otherwise, defaults toNULL, in which case bars start at the left (or bottom) end of a panel. This choice is somewhat unfortuntate, as it can be misleading, but is the default for historical reasons. For tabular (or similar) data,origin = 0is usually more appropriate; if not, one should reconsider the use of a bar chart in the first place (dot plots are often a good alternative).- reference
Logical, whether a reference line is to be drawn at the origin.
- stack
logical, relevant when groups is non-null. If
FALSE(the default), bars for different values of the grouping variable are drawn side by side, otherwise they are stacked.- groups
Optional grouping variable.
- col, border, lty, lwd
Graphical parameters for the bars. By default, the trellis parameter
plot.polygonis used if there is no grouping variable, otherwisesuperpose.polygonis used.colgives the fill color,borderthe border color, andltyandlwdthe line type and width of the borders.- ...
Extra arguments will be accepted but ignored.
- identifier
A character string that is prepended to the names of grobs that are created by this panel function.
Details
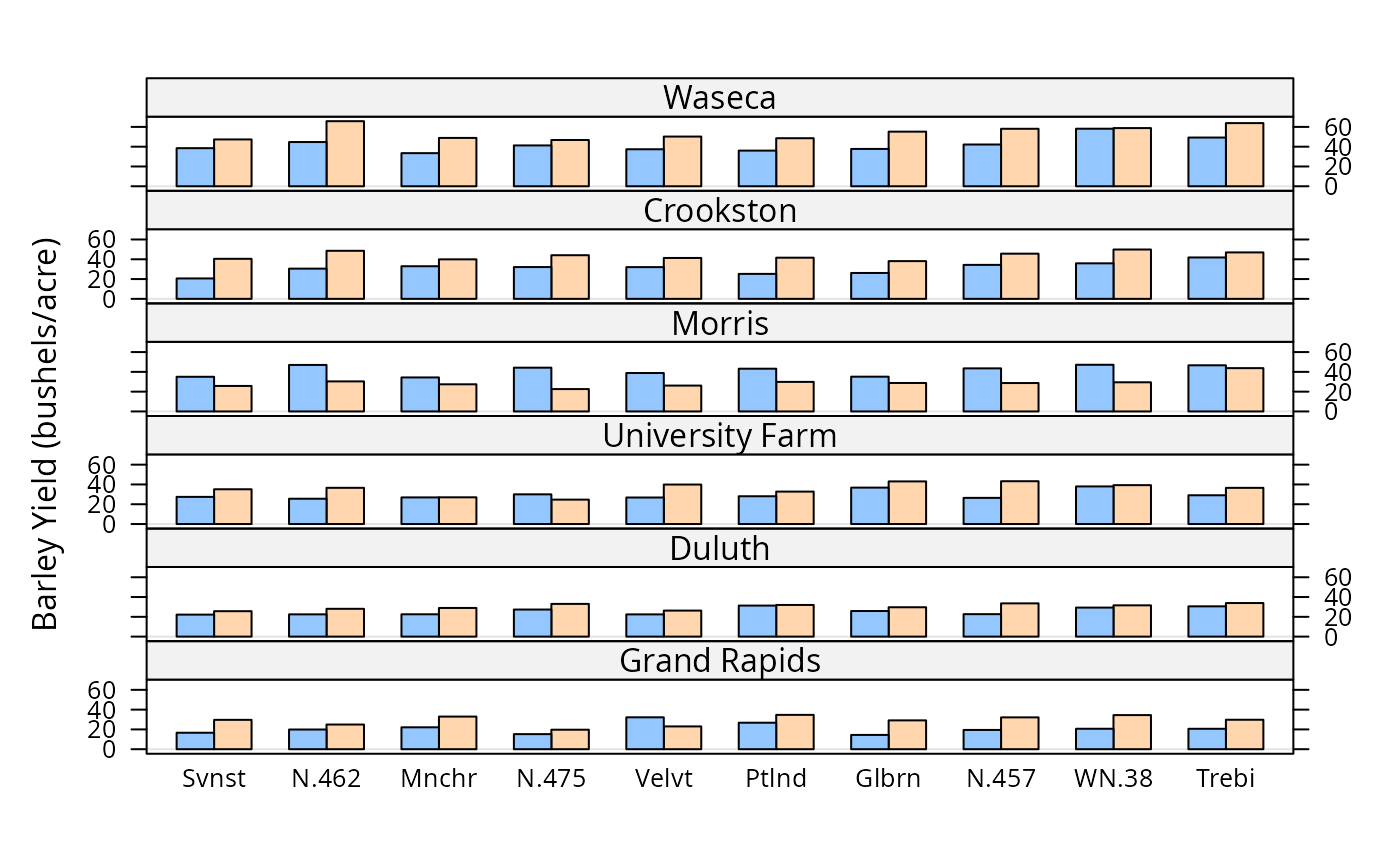
A barchart is drawn in the panel. Note that most arguments controlling
the display can be supplied to the high-level barchart call
directly.
Author
Deepayan Sarkar Deepayan.Sarkar@R-project.org