Replacements of traditional graphics functions
llines.RdThese functions are intended to replace common low level traditional graphics functions, primarily for use in panel functions. The originals can not be used (at least not easily) because lattice panel functions need to use grid graphics. Low level drawing functions in grid can be used directly as well, and is often more flexible. These functions are provided for convenience and portability.
lplot.xy(xy, type, pch, lty, col, cex, lwd,
         font, fontfamily, fontface,
         col.line, col.symbol, alpha, fill,
         origin = 0, ..., identifier, name.type)

larrows(...)
llines(x, ...)
lpoints(x, ...)
lpolygon(x, ...)
lpolypath(x, ...)
lrect(...)
lsegments(...)
ltext(x, ...)

# Default S3 method
larrows(x0 = NULL, y0 = NULL, x1, y1, x2 = NULL, y2 = NULL,
        angle = 30, code = 2, length = 0.25, unit = "inches",
        ends = switch(code, "first", "last", "both"),
        type = "open",
        col = add.line$col,
        alpha = add.line$alpha,
        lty = add.line$lty,
        lwd = add.line$lwd,
        fill = NULL,
        font, fontface,
        ..., identifier, name.type)
# Default S3 method
llines(x, y = NULL, type = "l",
        col, alpha, lty, lwd, ..., identifier, name.type)
# Default S3 method
lpoints(x, y = NULL, type = "p", col, pch, alpha, fill,
        font, fontfamily, fontface, cex, ..., identifier, name.type)
# Default S3 method
lpolygon(x, y = NULL,
        border = "black", col = "transparent", fill = NULL,
        font, fontface,
        ...,
        rule = c("none", "winding", "evenodd"),
        identifier, name.type)
# Default S3 method
lpolypath(x, y = NULL,
         border = "black", col = "transparent", fill = NULL,
         font, fontface,
         ...,
         rule = c("winding", "evenodd"),
         identifier, name.type)
# Default S3 method
ltext(x, y = NULL, labels = seq_along(x),
        col, alpha, cex, srt = 0,
        lineheight, font, fontfamily, fontface,
        adj = c(0.5, 0.5), pos = NULL, offset = 0.5, ..., identifier, name.type)
# Default S3 method
lrect(xleft, ybottom, xright, ytop,
        x = (xleft + xright) / 2,
        y = (ybottom + ytop) / 2,
        width = xright - xleft,
        height = ytop - ybottom,
        col = "transparent",
        border = "black",
        lty = 1, lwd = 1, alpha = 1,
        just = "center",
        hjust = NULL, vjust = NULL,
        font, fontface,
        ..., identifier, name.type)
# Default S3 method
lsegments(x0, y0, x1, y1, x2, y2,
        col, alpha, lty, lwd,
        font, fontface, ..., identifier, name.type)

panel.arrows(...)
panel.lines(...)
panel.points(...)
panel.polygon(...)
panel.rect(...)
panel.segments(...)
panel.text(...)
Arguments
- x, y, x0, y0, x1, y1, x2, y2, xy
locations.
x2andy2are available for for S compatibility.- length, unit
determines extent of arrow head.
lengthspecifies the length in terms ofunit, which can be any valid grid unit as long as it doesn't need adataargument.unitdefaults to inches, which is the only option in the base version of the function,arrows.- angle, code, type, labels, srt, adj, pos, offset
arguments controlling behaviour. See respective base functions for details. For
larrowsandpanel.larrows,typeis either"open"or"closed", indicating the type of arrowhead.- ends
serves the same function as
code, using descriptive names rather than integer codes. If specified, this overridescode- col, alpha, lty, lwd, fill, pch, cex, lineheight, font, fontfamily, fontface, col.line, col.symbol, border
graphical parameters.
fillapplies to points whenpchis in21:25and specifies the fill color, similar to thebgargument in the base graphics functionpoints. For devices that support alpha-transparency, a numeric argumentalphabetween 0 and 1 can controls transparency. Be careful with this, since for devices that do not support alpha-transparency, nothing will be drawn at all if this is set to anything other than 0.fill,fontandfontfaceare included inlrect,larrows,lpolygon, andlsegmentsonly to ensure that they are not passed down (asgpardoes not like them).- origin
for
type="h"ortype="H", the value to which lines drop down.- xleft, ybottom, xright, ytop
see
rect- width, height, just, hjust, vjust
finer control over rectangles, see
grid.rect- ...
extra arguments, passed on to lower level functions as appropriate.
- rule
character string specifying how
NAvalues are interpreted for polygons and paths. This is mainly intended for paths (viagrid.path), but can also be specified for polygons for convenience.For polygons, the default rule is
"none", which treatsNA-separated segments as separate polygons. This value is only valid for polygons. For the other rules ("winding"or"evenodd") these segments are interpreted as subpaths, possibly representing holes, of a single path, and are rendered usinggrid.path. Support and rendering speed may depend on the device being used.- identifier
A character string that is prepended to the name of the grob that is created.
- name.type
A character value indicating whether the name of the grob should have panel or strip information added to it. Typically either
"panel","strip","strip.left", or""(for no extra information).
Details
These functions are meant to be grid replacements of the corresponding
base R graphics functions, to allow existing Trellis code to be used
with minimal modification. The functions panel.* are
essentally identical to the l* versions, are recommended for
use in new code (as opposed to ported code) as they have more readable
names.
See the documentation of the base functions for usage. Not all arguments are always supported. All these correspond to the default methods only.
Note
There is a new type="H" option wherever appropriate, which is
similar to type="h", but with horizontal lines.
Examples
SD <- 0.1
t <- seq(0, 2*pi, length.out = 50) + rnorm(50, sd = SD)
d <- list(x = c(cos(t), NA, rev(0.5 * cos(t))) + rnorm(101, sd = SD),
y = c(sin(t), NA, rev(0.5 * sin(t))) + rnorm(101, sd = SD))
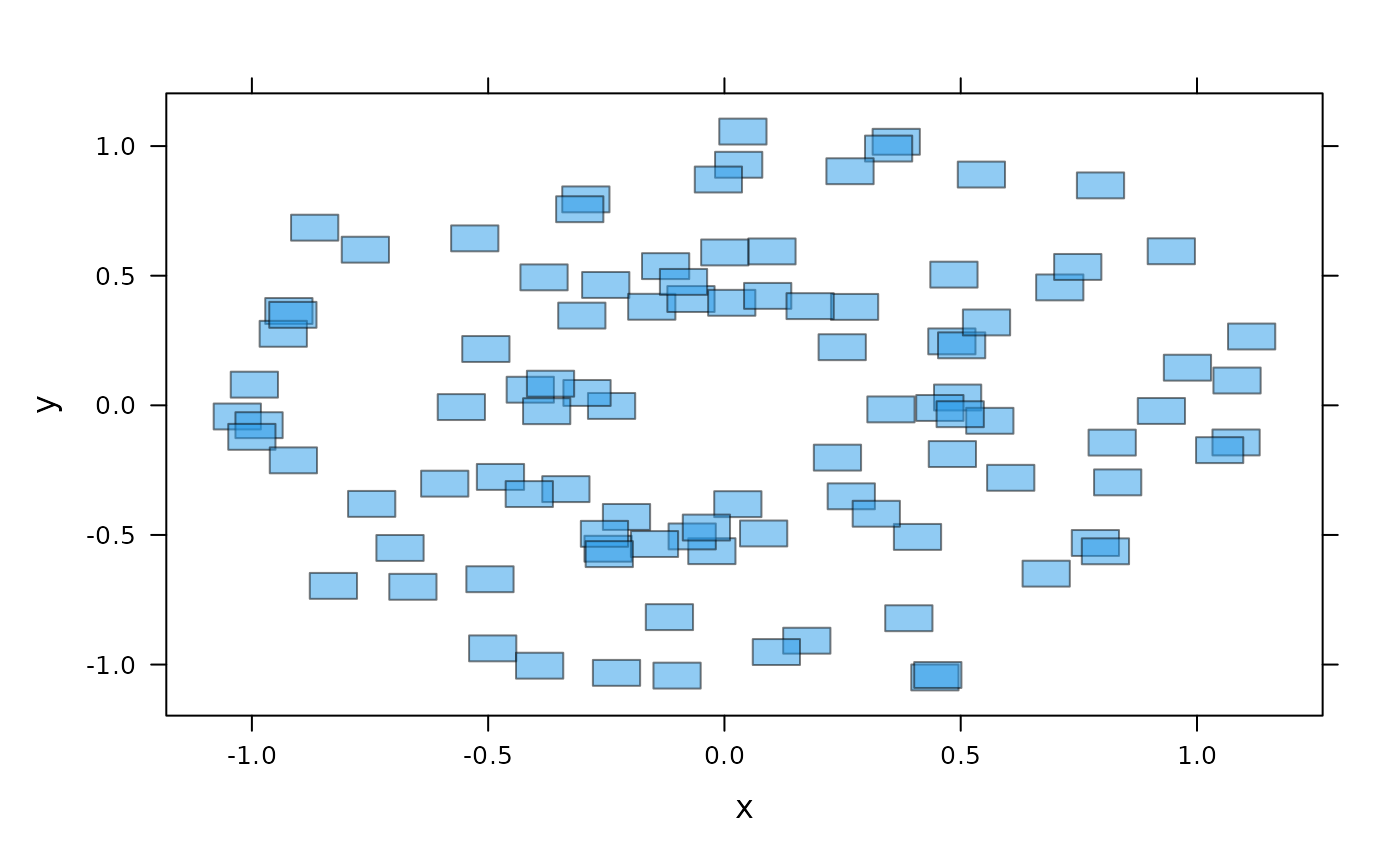
## rectangles
xyplot(y ~ x, d, panel = panel.rect, col = 4, alpha = 0.5, width = 0.1, height = 0.1)
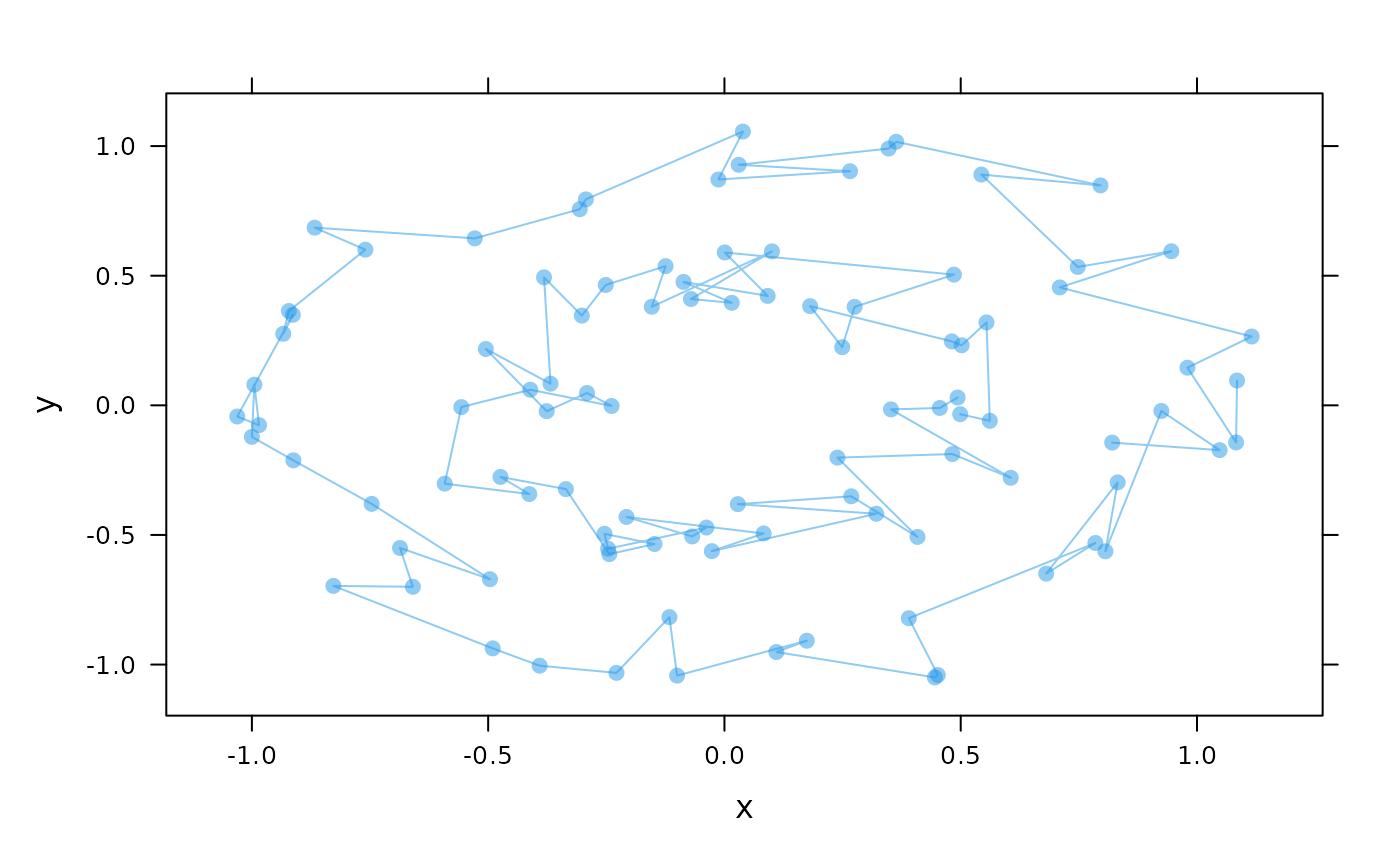
 ## points and lines
xyplot(y ~ x, d, panel = panel.lines, col = 4, alpha = 0.5,
type = "o", pch = 16)
## points and lines
xyplot(y ~ x, d, panel = panel.lines, col = 4, alpha = 0.5,
type = "o", pch = 16)
 ## polygons and paths (with holes)
xyplot(y ~ x, d, panel = panel.polygon, col = 4, alpha = 0.5, rule = "evenodd")
## polygons and paths (with holes)
xyplot(y ~ x, d, panel = panel.polygon, col = 4, alpha = 0.5, rule = "evenodd")
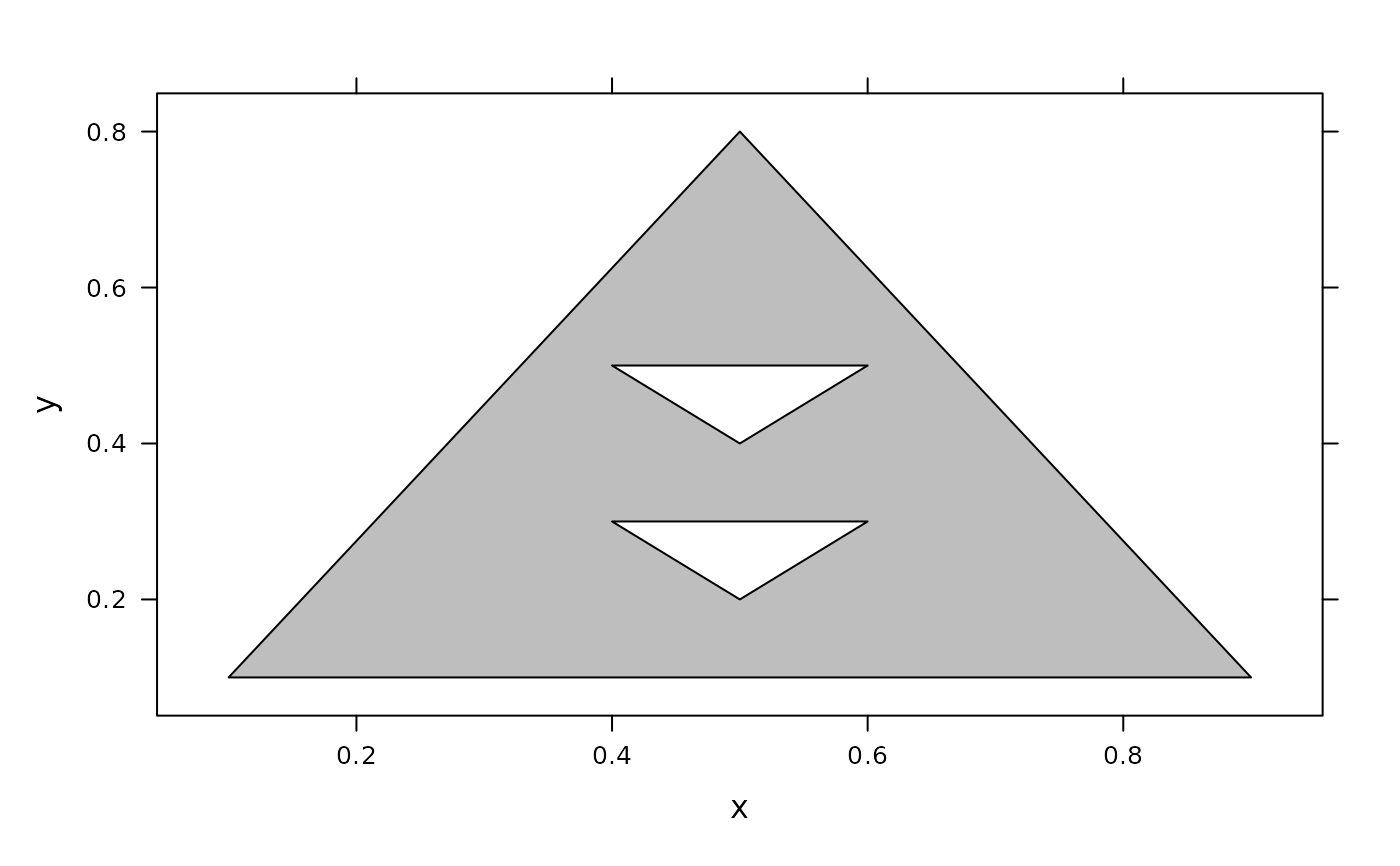
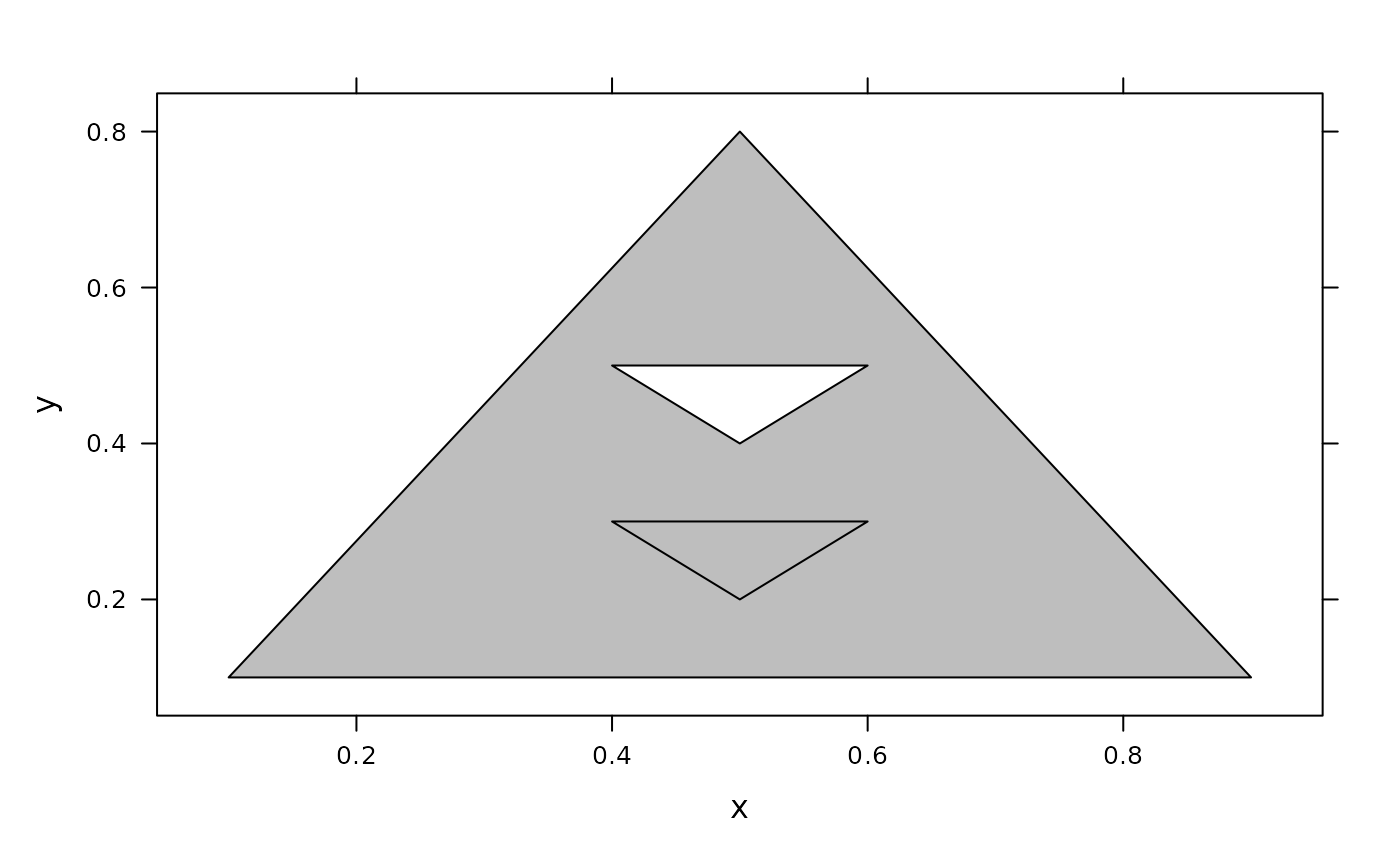
 ## Example adapted from https://journal.r-project.org/articles/RJ-2012-017/
x <- c(.1, .5, .9, NA, .4, .5, .6, NA, .4, .6, .5)
y <- c(.1, .8, .1, NA, .5, .4, .5, NA, .3, .3, .2)
d <- data.frame(x = x, y = y)
xyplot(y ~ x, data = d, panel = panel.polygon, rule = "none", col = "grey")
## Example adapted from https://journal.r-project.org/articles/RJ-2012-017/
x <- c(.1, .5, .9, NA, .4, .5, .6, NA, .4, .6, .5)
y <- c(.1, .8, .1, NA, .5, .4, .5, NA, .3, .3, .2)
d <- data.frame(x = x, y = y)
xyplot(y ~ x, data = d, panel = panel.polygon, rule = "none", col = "grey")
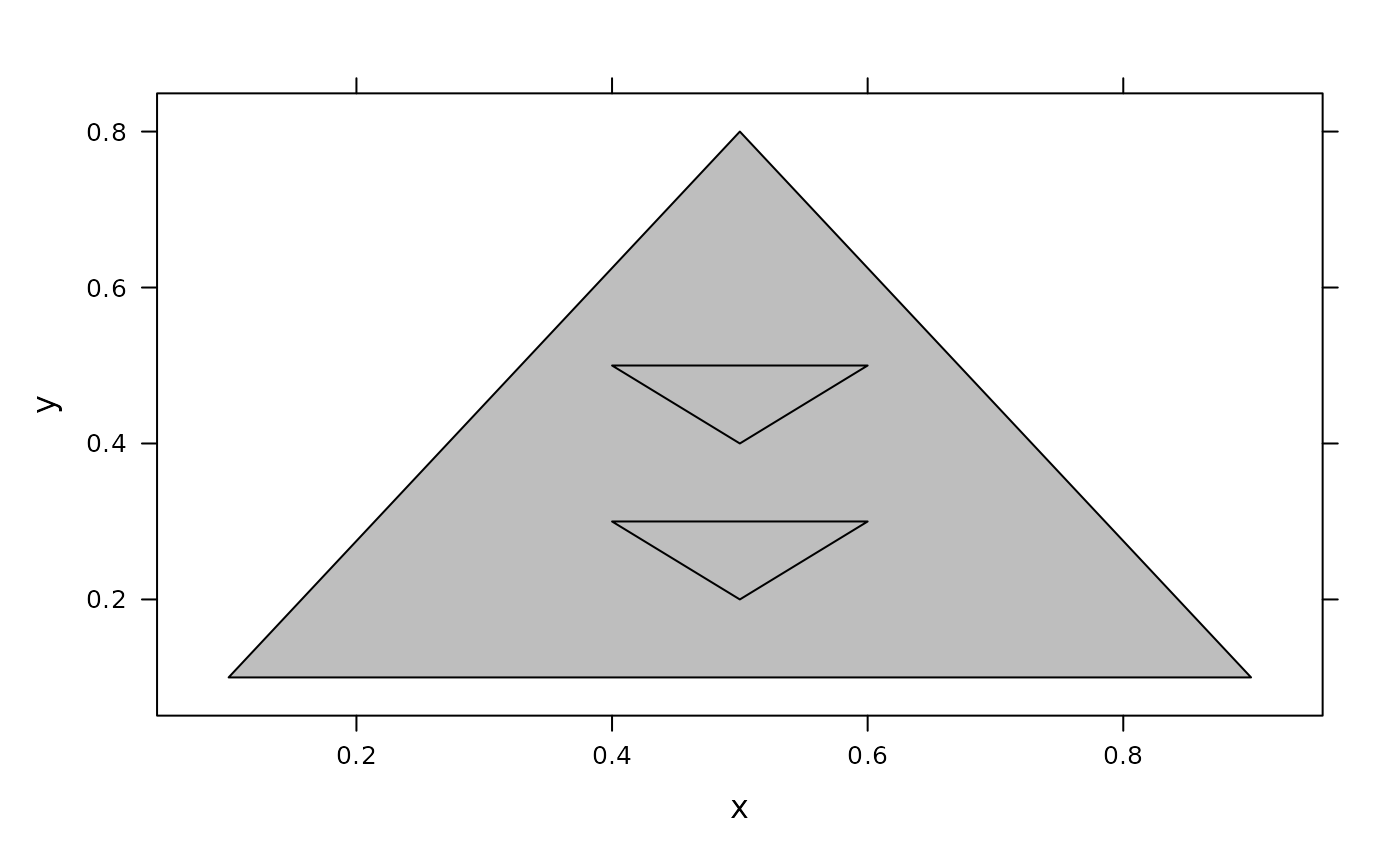 xyplot(y ~ x, data = d, panel = panel.polypath, rule = "winding", col = "grey")
 xyplot(y ~ x, data = d, panel = panel.polypath, rule = "evenodd", col = "grey")