Efficient calculation of isolines and isobands from elevation grid
isobands(x, y, z, levels_low, levels_high)

isolines(x, y, z, levels)
Arguments
- x
Numeric vector specifying the x locations of the grid points.
- y
Numeric vector specifying the y locations of the grid points.
- z
Numeric matrix specifying the elevation values for each grid point.
- levels_low, levels_high
Numeric vectors of minimum/maximum z values for which isobands should be generated. Any z values that are exactly equal to a value in
levels_loware considered part of the corresponding isoband, but any z values that are exactly equal to a value inlevels_highare not considered part of the corresponding isoband. In other words, the intervals specifying isobands are closed at their lower boundary and open at their upper boundary.- levels
Numeric vector of z values for which isolines should be generated.
See also
Examples
library(grid)
#' # one simple connected shape
m <- matrix(c(0, 0, 0, 0, 0, 0,
0, 0, 0, 1, 1, 0,
0, 0, 1, 1, 1, 0,
0, 1, 1, 0, 0, 0,
0, 0, 0, 1, 0, 0,
0, 0, 0, 0, 0, 0), 6, 6, byrow = TRUE)
df_bands <- isobands((1:ncol(m))/(ncol(m)+1), (nrow(m):1)/(nrow(m)+1), m, 0.5, 1.5)[[1]]
df_lines <- isolines((1:ncol(m))/(ncol(m)+1), (nrow(m):1)/(nrow(m)+1), m, 0.5)[[1]]
g <- expand.grid(x = (1:ncol(m))/(ncol(m)+1), y = (nrow(m):1)/(nrow(m)+1))
grid.newpage()
grid.points(g$x, g$y, default.units = "npc", pch = 19, size = unit(0.5, "char"))
grid.path(df_bands$x, df_bands$y, df_bands$id, gp = gpar(fill = "cornsilk", col = NA))
grid.polyline(df_lines$x, df_lines$y, df_lines$id)
 # a similar plot can be generated with the plot_iso() function,
# which is useful for exploring how the algorithm works
plot_iso(m, 0.5, 1.5)
# a similar plot can be generated with the plot_iso() function,
# which is useful for exploring how the algorithm works
plot_iso(m, 0.5, 1.5)
 # NAs are ignored
m <- matrix(c(NA, NA, NA, 0, 0, 0,
NA, NA, NA, 1, 1, 0,
0, 0, 1, 1, 1, 0,
0, 1, 1, 0, 0, 0,
0, 0, 0, 1, 0, 0,
0, 0, 0, 0, 0, 0), 6, 6, byrow = TRUE)
plot_iso(m, 0.5, 1.5)
# NAs are ignored
m <- matrix(c(NA, NA, NA, 0, 0, 0,
NA, NA, NA, 1, 1, 0,
0, 0, 1, 1, 1, 0,
0, 1, 1, 0, 0, 0,
0, 0, 0, 1, 0, 0,
0, 0, 0, 0, 0, 0), 6, 6, byrow = TRUE)
plot_iso(m, 0.5, 1.5)
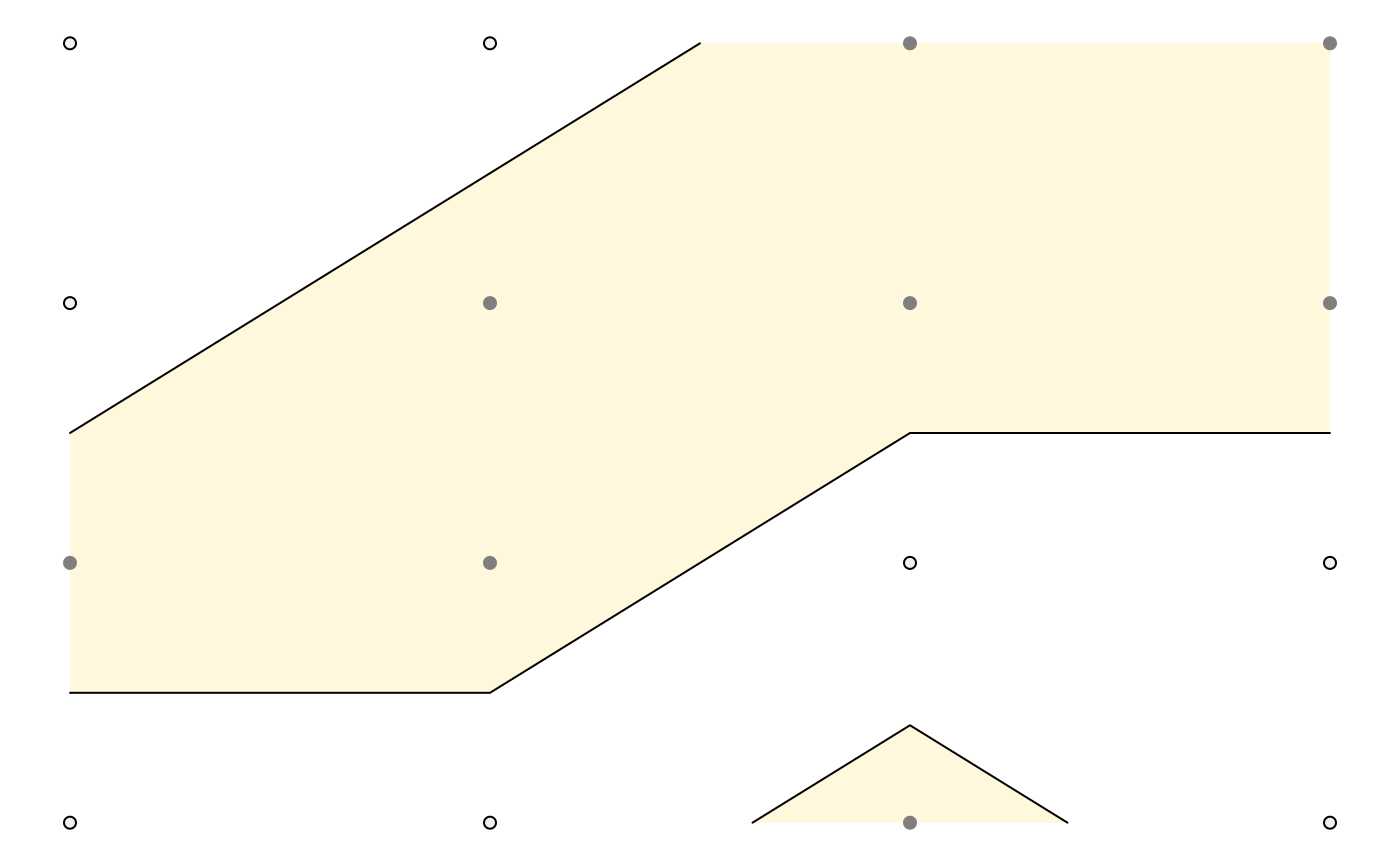
 # two separate shapes
m <- matrix(c(0, 0, 1, 1,
0, 1, 1, 1,
1, 1, 0, 0,
0, 0, 0.8, 0), 4, 4, byrow = TRUE)
plot_iso(m, 0.5, 1.5)
# two separate shapes
m <- matrix(c(0, 0, 1, 1,
0, 1, 1, 1,
1, 1, 0, 0,
0, 0, 0.8, 0), 4, 4, byrow = TRUE)
plot_iso(m, 0.5, 1.5)
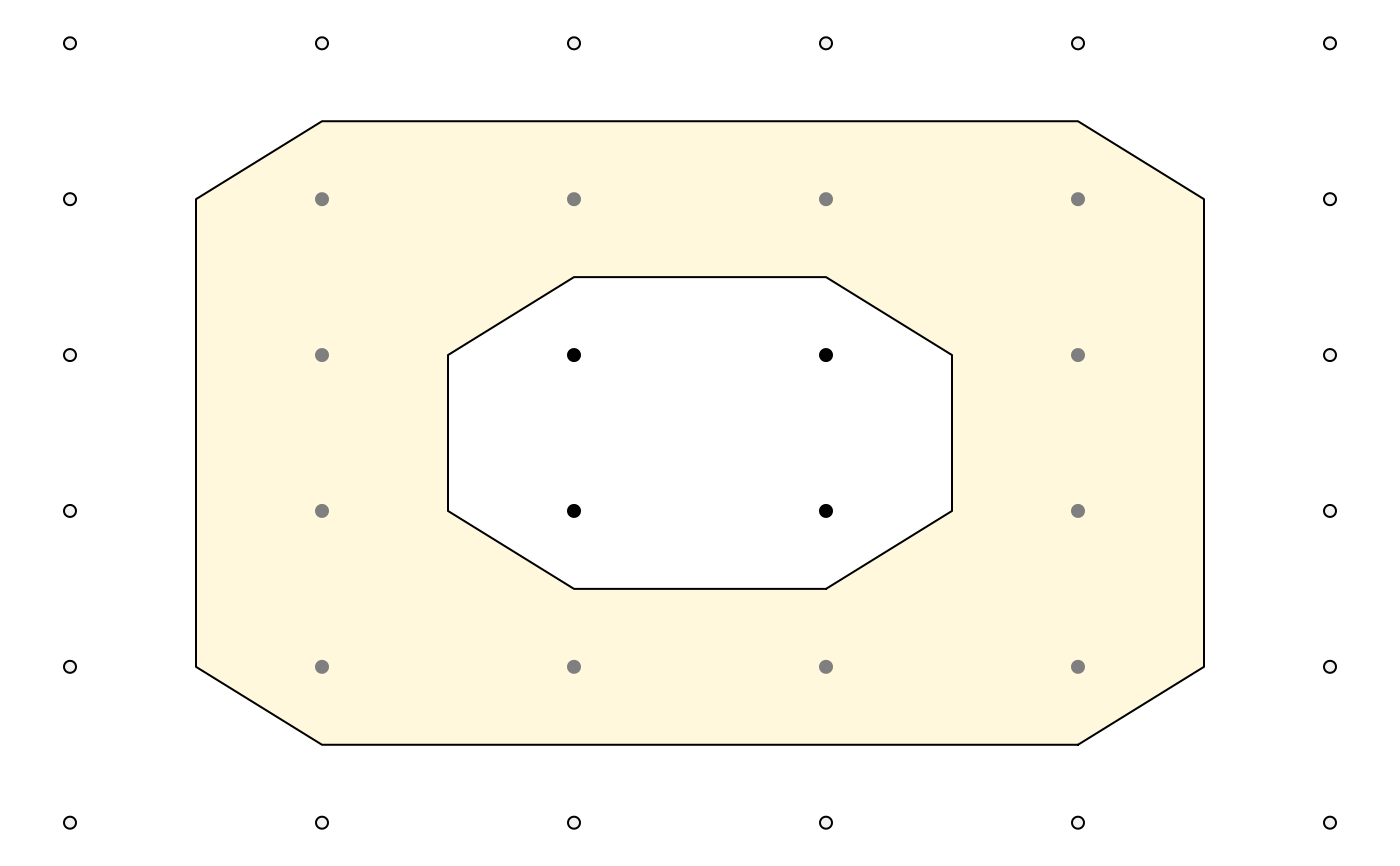
 # shape with hole
m <- matrix(c(0, 0, 0, 0, 0, 0,
0, 1, 1, 1, 1, 0,
0, 1, 2, 2, 1, 0,
0, 1, 2, 2, 1, 0,
0, 1, 1, 1, 1, 0,
0, 0, 0, 0, 0, 0), 6, 6, byrow = TRUE)
plot_iso(m, 0.5, 1.5)
# shape with hole
m <- matrix(c(0, 0, 0, 0, 0, 0,
0, 1, 1, 1, 1, 0,
0, 1, 2, 2, 1, 0,
0, 1, 2, 2, 1, 0,
0, 1, 1, 1, 1, 0,
0, 0, 0, 0, 0, 0), 6, 6, byrow = TRUE)
plot_iso(m, 0.5, 1.5)