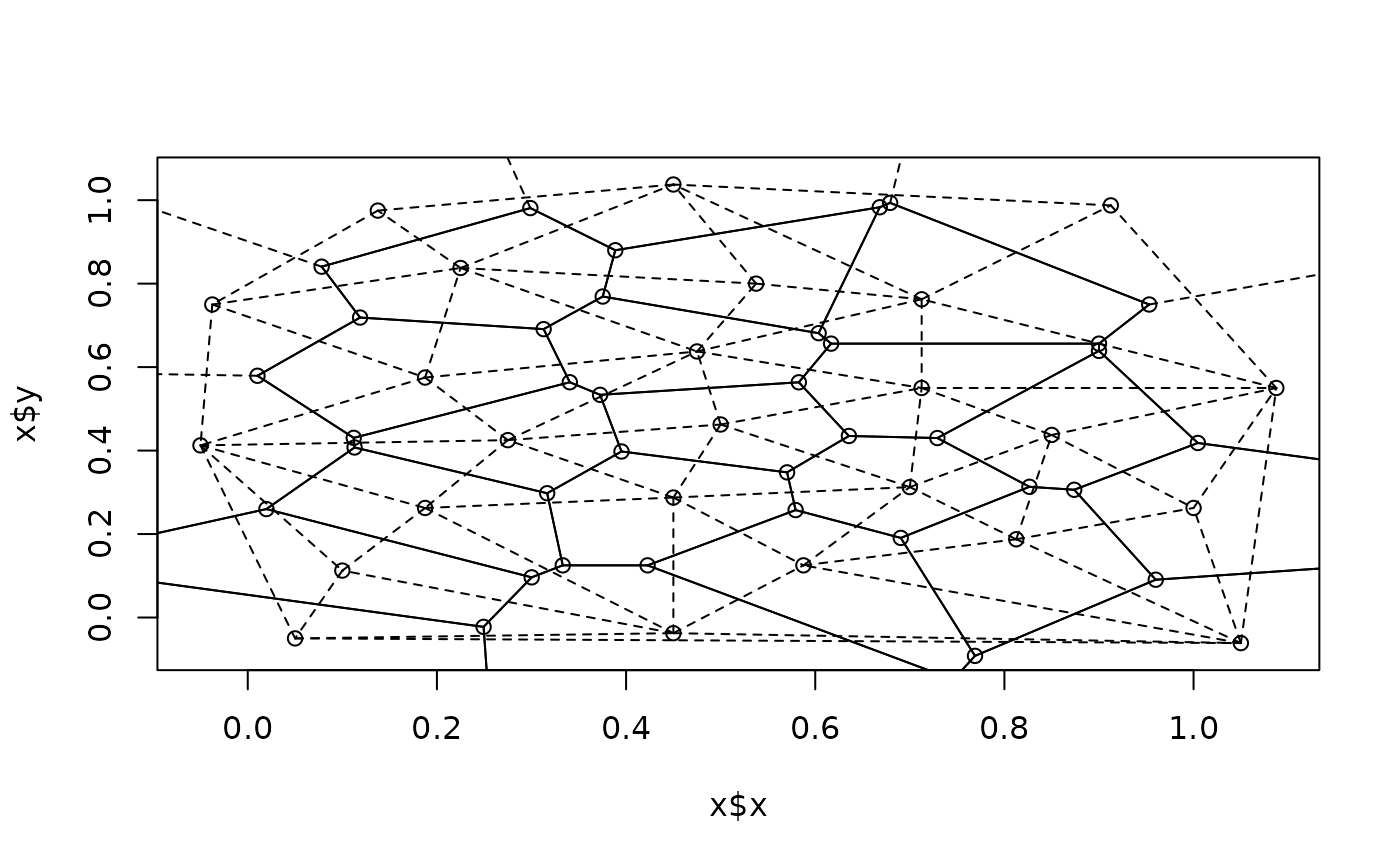
Plot a voronoi object
plot.voronoi.RdPlots the mosaic "x".
Dashed lines are used for outer tiles of the mosaic.
# S3 method for class 'voronoi'
plot(x,add=FALSE,
                           xlim=c(min(x$tri$x)-
                             0.1*diff(range(x$tri$x)),
                             max(x$tri$x)+
                             0.1*diff(range(x$tri$x))),
                           ylim=c(min(x$tri$y)-
                             0.1*diff(range(x$tri$y)),
                             max(x$tri$y)+
                             0.1*diff(range(x$tri$y))),
                           all=FALSE,
                           do.points=TRUE,
                           main="Voronoi mosaic",
                           sub=deparse(substitute(x)),
                           isometric=TRUE,
                           ...)
Arguments
- x
object of class
"voronoi"- add
logical, if
TRUE, add to a current plot.- xlim
x plot ranges, by default modified to hide dummy points outside of the plot
- ylim
y plot ranges, by default modified to hide dummy points outside of the plot
- all
show all (including dummy points in the plot
- do.points
logical, indicates if points should be plotted.
- main
plot title
- sub
plot subtitle
- isometric
generate an isometric plot (default
TRUE)- ...
additional plot parameters
Value
None
See also
Examples
data(franke)
tr <- tri.mesh(franke$ds3)
vr <- voronoi.mosaic(tr)
plot(tr)
plot(vr,add=TRUE)